VPS CPU Steal Time: How to Measure It, With Vultr Results
By RenUpdated Oct 28, 2026Infra
In this article
- What CPU steal time actually measures
- How to measure CPU steal time with vmstat, top, and mpstat
- What CPU steal looked like on 4 real Vultr instances
- When steal time actually means trouble
- Vultr’s plan lineup: shared vCPU vs dedicated vCPU
- Diagnosis workflow: from suspicion to confirmed noisy neighbor
- Measure before you upgrade
CPU steal time on a VPS (%st in top, st in vmstat) is the share of time your virtual CPU was ready to run but waited while the hypervisor served another guest. On Vultr, Regular Performance, High Performance and High Frequency plans run on shared vCPUs; Optimized Cloud Compute and VX1 use dedicated vCPUs. Four fresh Vultr instances we sampled on September 25, 2026 showed 0% steal.
This post contains affiliate links. If you purchase through our links, we may earn a commission at no extra cost to you.
What CPU steal time actually measures
CPU steal time (shown as %st in top, the st column in vmstat, and %steal in mpstat) is the percentage of time your virtual CPU wanted to run instructions but had to wait because the hypervisor gave the physical core to a different guest instead. It only exists in virtualized environments; on bare metal, there’s no hypervisor scheduling other tenants ahead of you, so the metric is meaningless there. Site24x7 puts it plainly: a reading like “20st” means 20% of total process time was spent waiting for a physical core to free up, with 100.0 as the theoretical ceiling.
How to measure CPU steal time with vmstat, top, and mpstat
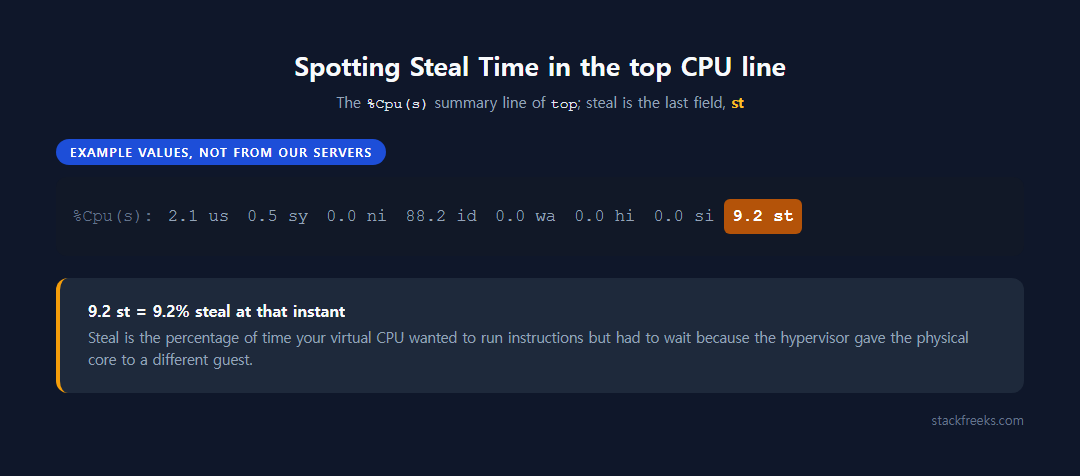
top: steal shows up in the %Cpu(s) summary line:
%Cpu(s): 2.1 us, 0.5 sy, 0.0 ni, 88.2 id, 0.0 wa, 0.0 hi, 0.0 si, 9.2 stThat 9.2 st at the end means 9.2% steal at that instant.
vmstat: run vmstat 1 for a one-second sampling interval. The rightmost column in the CPU section is labeled st, and watching it over a minute or two tells you whether steal is a blip or a pattern.
mpstat -P ALL 1 30: the most useful of the three for diagnosis. The -P ALL flag breaks the reading down per core, sampled every second for 30 samples, with its own %steal column. That per-core view matters: it lets you tell whether steal is concentrated on one vCPU (possibly a pinning issue) or spread evenly across all of them (more consistent with host-wide contention).
CPU %usr %nice %sys %iowait %irq %soft %steal %guest %gnice %idle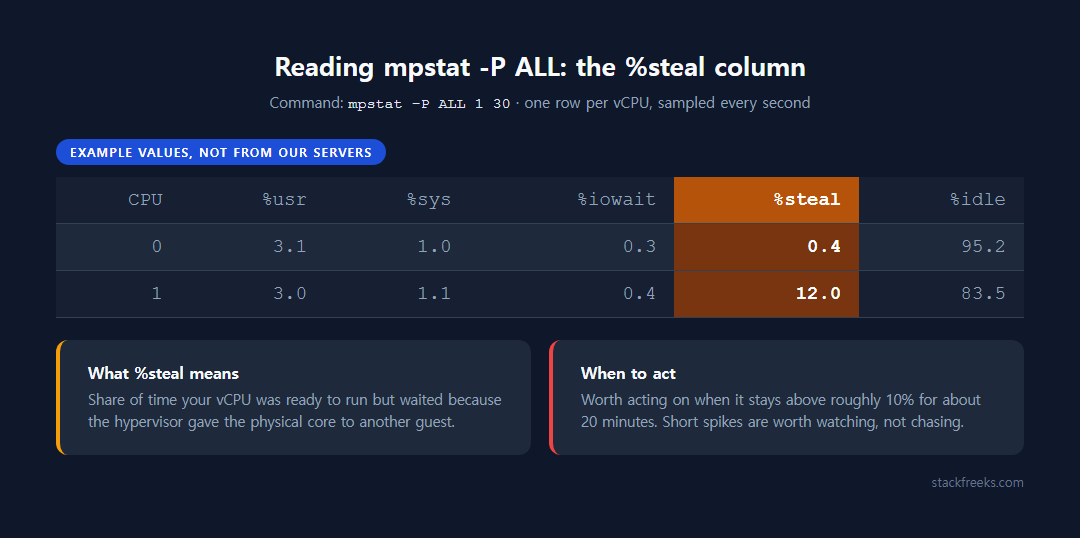
What CPU steal looked like on 4 real Vultr instances
To see what these commands report on real Vultr hardware, we ran them ourselves. On September 25, 2026 (around 08:37 UTC) we created four fresh Vultr instances, all 1 vCPU / 1 GB RAM on Ubuntu 24.04: three in Tokyo (one each on Regular Performance, High Frequency and High Performance AMD) plus a second Regular Performance box in Singapore. On each one we sampled steal at idle, then again while a single-threaded sysbench CPU test kept the vCPU fully busy. These are the exact commands:
vmstat 1 30                  # idle: 30 one-second samples
mpstat -P ALL 1 10           # idle: per-core %steal
sysbench cpu --threads=1 --time=30 run
(sysbench cpu --threads=1 --time=35 run >/dev/null &); sleep 2; vmstat 1 30 # steal under load| Plan | Region | CPU model (lscpu) | vmstat st idle, avg / max % | vmstat st under load, avg / max % | sysbench CPU events/sec |
|---|---|---|---|---|---|
Regular Performancevc2-1c-1gb, $5/mo | Tokyo | Intel Core Processor (Broadwell, no TSX, IBRS) | 0 / 0 | 0 / 0 | 817.61 |
High Frequencyvhf-1c-1gb, $6/mo | Tokyo | Intel Core Processor (Skylake, IBRS, no TSX) | 0 / 0 | 0 / 0 | 1,170.04 |
High Performance AMDvhp-1c-1gb-amd, $6/mo | Tokyo | AMD EPYC-Rome Processor | 0 / 0 | 0 / 0 | 4,303.83 |
Regular Performancevc2-1c-1gb, $5/mo | Singapore | Intel Core Processor (Broadwell, no TSX, IBRS) | 0 / 0 | 0 / 0 | 729.89 |
Here’s the Tokyo Regular Performance box, the cheapest plan in the test, while sysbench was running. The first row under the header is vmstat’s since-boot average (that’s why it shows 37 in us), and every live sample after it looks the same: us pinned at 100, st at 0.
procs -----------memory---------- ---swap-- -----io---- -system-- -------cpu-------
 r  b   swpd   free   buff  cache   si   so    bi    bo   in   cs us sy id wa st gu
 2  0    268 102248  22852 650000    0    0  2117  2269  575    6 37  7 54  2  0  0
 1  0    268 102248  22852 650000    0    0     0     0 1008   49 100  0  0  0  0  0
 1  0    268 102248  22852 650000    0    0     0     0 1009   53 100  0  0  0  0  0
 1  0    268 102248  22852 650000    0    0     0     0 1013   57 100  0  0  0  0  0
 1  0    268 102248  22852 650000    0    0     0     0 1007   40 100  0  0  0  0  0
 1  0    268 102248  22860 649992    0    0     0    32 1015   58 100  0  0  0  0  0
That pattern held on all four instances. Every one of the 29 idle and 29 loaded samples on every box showed 0 in the st column, and mpstat averaged 0.00 %steal at idle on all four. One caveat on resolution: vmstat reports whole percentages, so a fraction of a percent of steal can still print as 0.
What this doesn’t show is that these plans are immune. Steal depends on what the other tenants on that physical host happen to be doing, and each of our samples covered 30 seconds on one host at one moment. Measured against the usual bar (sustained steal above roughly 10% for about 20 minutes, covered below), we were nowhere near it, but a 30-second window can’t clear a host any more than one bad reading can convict it. That’s the whole reason the workflow below says to sample during the period when your app is actually slow and to compare against an identical instance: a clean reading on a fresh VM at 08:37 UTC says nothing about your VM at peak hour.
The sysbench column is a side note, but a telling one. With zero measured steal on both, the Singapore Regular box still scored 729.89 events/sec against its Tokyo twin’s 817.61, and the High Performance AMD instance did more than five times the Regular Performance figure. Whatever separated those numbers, it wasn’t steal, which is exactly why you check the st column before blaming the neighbors for a slow box.
Our free VPS cost calculator can help if this diagnosis ends with “time to move plans” (more on that below).
When steal time actually means trouble
A steal reading above zero isn’t automatically a problem: brief spikes happen on almost any shared host and aren’t worth chasing. What matters is whether it’s sustained. Two independent sources converge on the same rule of thumb: Scout Monitoring and GetPageSpeed both cite sustained CPU steal time above roughly 10% for about 20 minutes as the threshold where your VM is genuinely running slower than it should, and where it’s worth acting rather than just watching.
Vultr’s plan lineup: shared vCPU vs dedicated vCPU
Regular Performance / Cloud Compute is the entry-level, cheapest tier. It runs on previous-generation Intel CPUs with standard (non-NVMe) SSD storage, and the vCPU is a shared time-slice of a physical core also used by other tenants, so performance can vary with what your neighbors are doing. WebHostingGeeks positions this tier for development and testing environments, low-traffic sites, and small databases: workloads that can shrug off occasional steal without anyone noticing.
High Frequency Compute is also shared-vCPU, but built on higher-clock-speed CPUs with NVMe storage, aimed at workloads that need fast single-core throughput. It starts at $6/month for 1 vCPU, 1 GB RAM, and 32 GB NVMe. It’s still a shared-tenancy product, not marketed as dedicated, so steal time is still possible on it in principle, but the faster hardware and NVMe I/O tend to reduce how much a given percentage of steal actually hurts in practice.
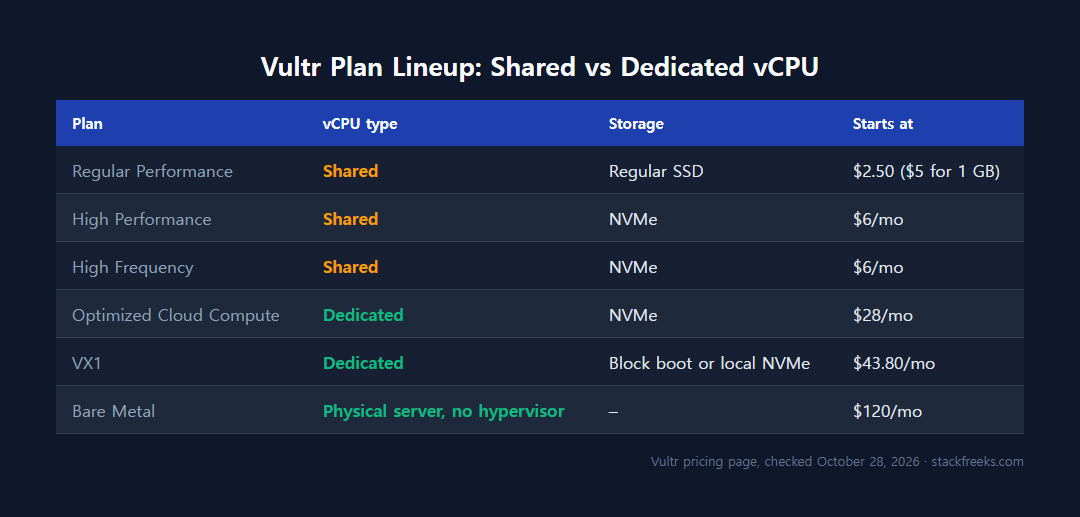
Optimized Cloud Compute is Vultr’s dedicated-vCPU tier. Vultr’s Optimized Cloud Compute page describes it as “capable infrastructure without noisy neighbor concerns”, while Vultr’s pricing page says its Cloud Compute plans “run atop shared vCPUs”. On October 28, 2026 it started at $28/month (CPU Optimized, 1 vCPU / 2 GB) and $30/month (General Purpose, 1 vCPU / 4 GB); General Purpose with 4 vCPU / 16 GB is $120. This is the tier to reach for once you’ve confirmed sustained steal on a shared plan.
VX1 is Vultr’s other dedicated-CPU line, from $43.80/month for 2 vCPU / 8 GB. Vultr’s VX1 docs (updated April 15, 2026) say automated backups are currently disabled and Windows is currently not available on it.
Bare Metal removes the hypervisor layer entirely, so there is no steal to measure. It starts at $120/month (Intel E3-1270, 4 cores / 8 threads, 32 GB RAM), well above the shared Cloud Compute tiers.
Vultr prices above are from Vultr’s pricing page, checked October 28, 2026.
For benchmarks and prices side by side, see Vultr Cloud Compute vs High Frequency.
If you’re weighing the jump past virtualized plans, see Vultr Bare Metal vs Cloud Compute: when to upgrade.
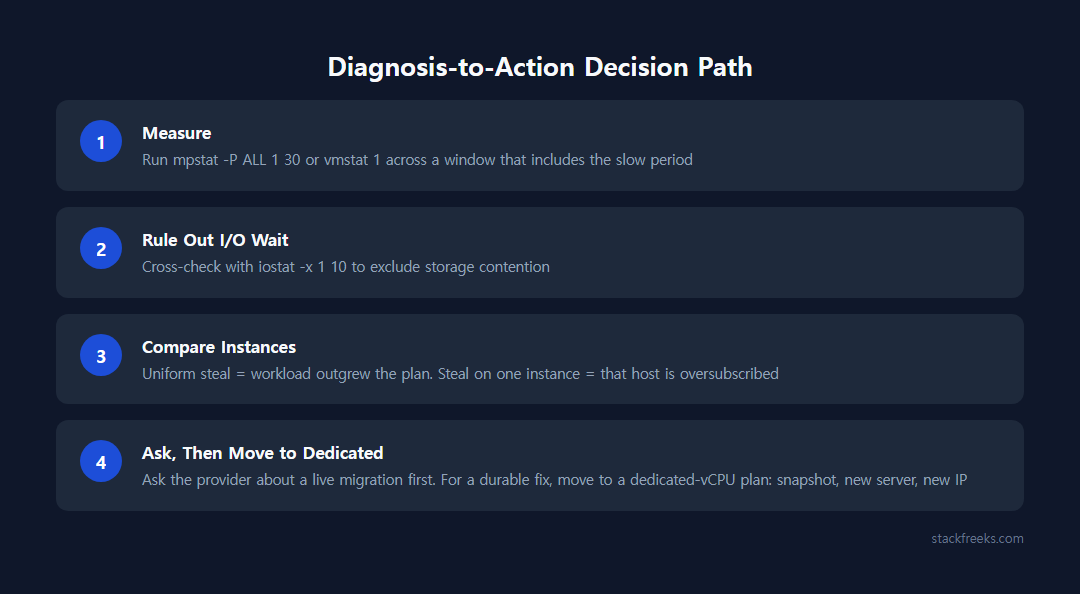
Diagnosis workflow: from suspicion to confirmed noisy neighbor
- Measure first, don’t assume. Run
mpstat -P ALL 1 30orvmstat 1across a window that includes the slow period. One elevated reading isn’t evidence; you’re looking for sustained steal, using the ~10%-for-20-minutes threshold above as your bar. - Rule out I/O wait. Cross-check with
iostat -x 1 10before concluding it’s steal and not storage contention. High load average with low CPU usage often means the disk queue, not the hypervisor scheduler, is your bottleneck. - Isolate cause from symptom. Compare steal across identical-spec instances. Uniform elevated steal means your workload has outgrown the plan. Isolated elevated steal on one instance means that specific host is oversubscribed.
- If it’s confirmed and sustained on a shared plan: request a live migration to a different physical host first. GetPageSpeed cites a real case where a single provider-side migration immediately normalized load and responsiveness. If migration doesn’t fix it, escalate to the provider about potential overselling. For a durable fix rather than a repeat of this cycle, move to a dedicated-vCPU tier.
- Reduce sensitivity to steal at the application level, independent of any infrastructure change: add a caching layer (Varnish, Redis) so fewer requests depend on raw CPU availability, decouple I/O from the request path, batch database writes, and use async workers so a short steal spike doesn’t translate directly into a user-facing delay.
Measure before you upgrade
If you confirm sustained steal on a Vultr Regular, High Performance or High Frequency plan, the same-provider fix is a dedicated-vCPU plan: Vultr Optimized Cloud Compute (from $28/month) or VX1 (from $43.80/month). It is not an in-place plan change: Vultr’s upgrade docs say moving from Cloud Compute to Optimized Cloud Compute means taking a snapshot, deploying a new server from it, and getting a new IP address. Diagnose first, upgrade second. Guessing which plan to buy without ever running vmstat is how people end up paying for dedicated cores they didn’t need, or staying on shared ones they should have left months ago.
If you’re running a dev/staging environment, a personal blog, a low-traffic side project, or anything where occasional slowdowns don’t cost you money or users, staying on a shared plan and just keeping an eye on vmstat periodically is the more rational call. Paying for dedicated cores you don’t need is its own kind of waste.
Every tier and its add-on costs are listed in Vultr pricing: every plan and hidden costs.