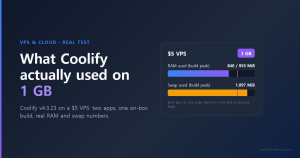
Yes, a 1 GB VPS is enough for Uptime Kuma. On a 1 vCPU / 1 GB Vultr box, Uptime Kuma 2.5.9 (full Docker image, SQLite) used about 170 MB of process RSS idle and about 181 MB with 110 monitors running, and the server still had 455 MB available. That Uptime Kuma RAM figure barely moved between 20 and 110 monitors.
This post contains affiliate links. If you purchase through our links, we may earn a commission at no extra cost to you.
The guides disagree (a 256 MB container, a 512 MB limit, "1 GB minimum"), and the only measured number in our research, 136 MB idle on 2.5.0 from a Lemmy post, had no monitors at all. So on 2026-11-08 we ran Kuma on Vultr's $5 1 GB plan, added monitors in steps and logged memory about every 53 seconds. It's one short run with about 25 minutes of steady sampling at the top step, plus a swap-out we can't explain and a firewall rule that cost us our first run's data.
Uptime Kuma RAM usage at 0, 20, 60 and 110 monitors
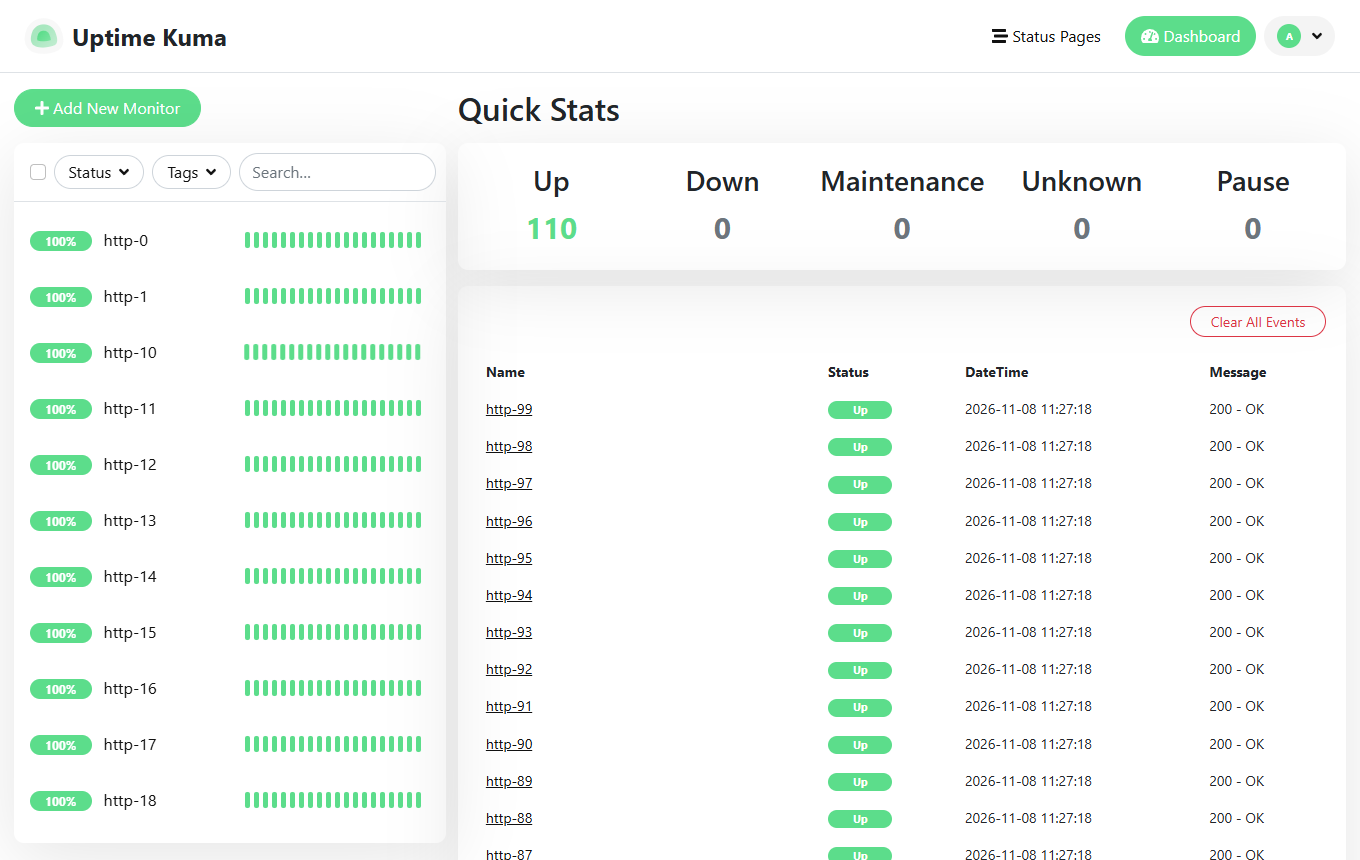
The summed process RSS stayed between about 170 MB and 183 MB from zero monitors to 110, and the box kept 438 to 458 MB available at every step. Going from 20 to 110 monitors changed RSS by less than 6 MB.
Test setup: 2026-11-08 (UTC), Vultr Tokyo, plan vc2-1c-1gb (1 vCPU, 1 GB RAM, 25 GB SSD; free -m reports 955 MB total), Ubuntu 24.04.5 LTS, Docker 29.9.3, nginx 1.24.0 as the check target. Uptime Kuma 2.5.9 (read from /app/package.json in the container), Node v22.23.4, image louislam/uptime-kuma:2 (full), SQLite. To repeat it, the same Vultr 1 GB plan is about $5/month (checked 2026-11-08; Vultr's API showed $0.007/hour during the test).
docker run -d --restart=always -p 127.0.0.1:3001:3001 \
  -v kuma-data:/app/data -e UPTIME_KUMA_DB_TYPE=sqlite \
  --name kuma louislam/uptime-kuma:2
A script added monitors through Kuma's Socket.IO add event. Each HTTP monitor fetched the box's own nginx (http://172.17.0.1/) every 60 seconds, 48-second timeout, no retries. The first batch also had 5 TCP (port 80) and 5 ping monitors, so the step we planned as "10 monitors" was really 20. Before each reading, Kuma's /metrics had to show every monitor UP, then we waited about 5 minutes and took docker stats --no-stream, free -m and VmRSS/VmSwap from /proc/<pid>/status.
| Monitors (all UP) | Snapshot (UTC) | Process RSS sum | VmRSS | docker stats | free -m available | CPU |
|---|---|---|---|---|---|---|
| 0, idle after setup | 02:17:33 | 170,428 KB | 167,132 kB | 193.6 MiB | 438 MB | 0.73% |
| 20 (10 HTTP + 5 TCP + 5 ping) | 02:22:23 | 177,668 KB | 174,372 kB | 201.6 MiB | 458 MB | 0.60% |
| 60 (50 HTTP + 5 TCP + 5 ping) | 02:27:13 | 183,280 KB | 179,984 kB | 207.3 MiB | 447 MB | 1.11% |
| 110 (100 HTTP + 5 TCP + 5 ping) | 02:32:04 | 180,768 KB | 177,472 kB | 146.6 MiB | 455 MB | 0.87% |
Uptime Kuma 2.5.9, full image, SQLite, 60 s intervals, 1 vCPU / 1 GB Vultr, Ubuntu 24.04.5. One run (run 2), about 5 minutes settle per step.
docker stats was the noisy number. Idle, it read 122.7 MiB in our first run and 193.6 MiB in the second, while the main process's RSS agreed within 2 MB (169,076 KB vs 167,132 KB). At the 110 step it read 214.9 MiB on the first sample, then settled near 147 MiB while RSS barely moved. In this run, then, docker stats tracked something other than what Kuma's process was holding, so we use process RSS for the comparisons. It has one catch: it leaves out pages in swap. If you want to cap Kuma with --memory, our guide to Docker container memory limits covers setting them.
25 minutes at 110 monitors: flat, then a swap-out
Over the healthy window (02:32:45 to 02:57:34 UTC, 29 samples, all 110 monitors up) Kuma's RSS rose 3.4 MB, from 177.6 to 181.0 MB. No sign of a leak there, but 25 minutes can't rule out a slow one.
| Over the 25-minute window | Min | Avg | Max |
|---|---|---|---|
| Process RSS sum (MB) | 177.6 | 180.8 | 182.8 |
docker stats (MiB) | 147.7 | 151.0 | 153.0 |
| MemAvailable (MB) | 408 | 443.2 | 451 |
System swap stayed at 34 MB, Kuma's VmSwap at 0, and the 1-minute load average never passed 0.36.
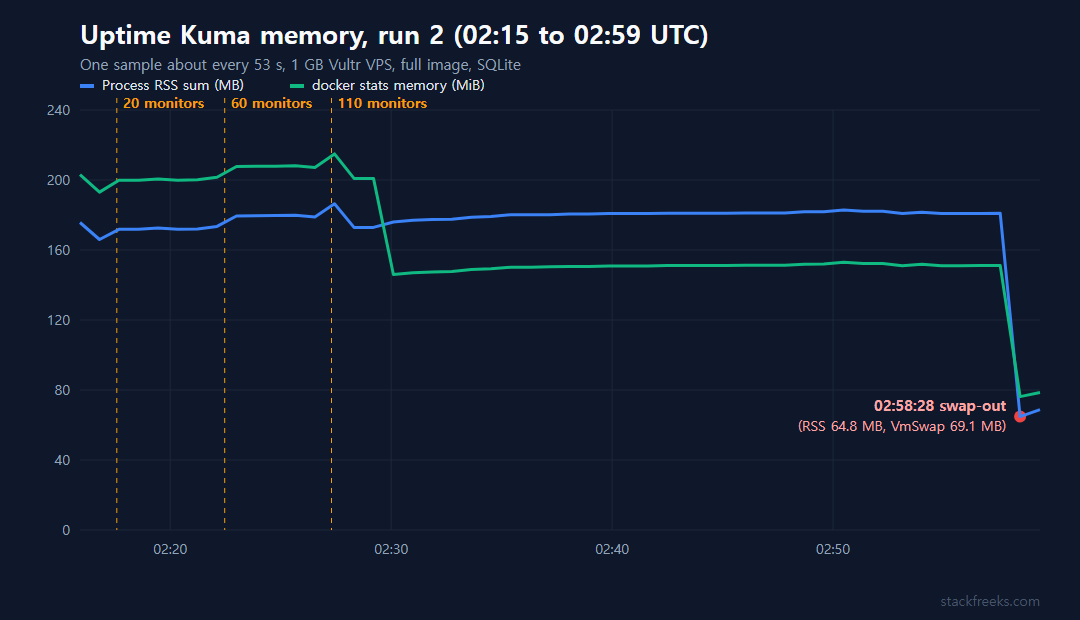
Then, between the 02:57:34 and 02:58:28 samples, the kernel moved part of Kuma into swap. RSS fell from 181.0 to 64.8 MB, VmSwap went from 0 to 69.1 MB (73.1 MB a minute later), system swap jumped from 34 to 210 MB, and docker stats dropped from 151.2 to 76.25 MiB. The window's lowest MemAvailable, 408 MB, was the sample just before it.
Nothing broke. MemAvailable stayed between 455 and 530 MB, dmesg had no OOM message, the container wasn't OOM-killed or restarted, and all 110 monitors were UP at 02:59:56. We didn't find the cause. After we opened the dashboard for the screenshot, docker stats was back at 145.2 MiB. So on a box with swap, a sudden "Kuma dropped to 65 MB" reading likely means pages went to swap; check VmSwap before you believe it.
Vultr's Ubuntu 24.04 image ships with a 2.3 GB swapfile already on. If your provider's image has none, our Linux swap size calculator gives a starting size for a 1 GB plan.
How much of a 1 GB VPS is left after Uptime Kuma
About 455 MB of the 955 MB (48%) was still available with 110 monitors, Docker and nginx running; the lowest reading over 25 minutes was 408 MB (43%). Kuma itself was about 180 MB of RSS, roughly 19% of the box.
Stage (run 2, free -m) | Used | Available |
|---|---|---|
| Fresh Ubuntu 24.04.5, nothing installed | 298 MB | 657 MB |
| Docker and nginx installed | 416 MB | 539 MB |
| Kuma 2.5.9, 110 monitors, snapshot | 500 MB | 455 MB |
| Same, 25-minute window | avg 443 MB, low 408 MB |
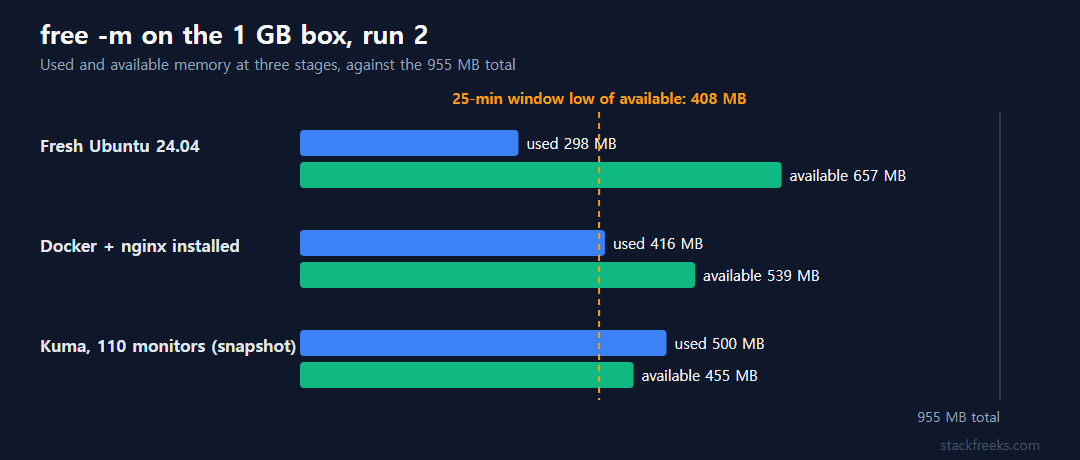
That puts the co-hosting limit at about 400 MB. Use the window low (408 MB), not the snapshot, because that's the worst moment you'd actually have, and whatever else runs on the box has to fit its peak inside it. nginx was already running in these numbers, so a reverse proxy or static site is covered. Anything bigger, such as an app with its own database, should be measured on its own first; our Coolify 1 GB test on the same plan shows what a heavier tenant does to this plan.
There's no "max monitors" figure to derive: with under 6 MB of change between 20 and 110 monitors, any line drawn to 500 or 1,000 would be a guess. For comparison, the Lemmy author's rule of thumb (136 MB idle plus about 300 MB for the OS plus 30% headroom, roughly 570 MB) is close to what this box used: 500 MB with Kuma, Docker and nginx.
The 256 MB, 512 MB and "1 GB minimum" claims, checked
Kuma's README gives no RAM requirement, so the numbers in circulation are guesses. Against this run, most are on the cautious side.
- 256 MB or 512 MB container limits. A linux-server-admin.com wiki suggests a 512M limit with a 256M reservation, and a Virtua Cloud tutorial runs Kuma under 256m next to Beszel. A "256 MB" figure credited to the maintainer isn't in the GitHub thread it's attributed to (#3276). In our first run,
--memory=256m --memory-swap=256mwith 110 monitors all UP held for about 5 minutes at 165.0 to 168.1 MiB (65% of the limit), with no OOM kill or restart. We didn't push it to find where it breaks. - 1 GB minimum, 2 GB+ for many monitors or co-hosting (nzian.xyz). Fine as a server size; Kuma alone used under a fifth of it.
- 136 MB idle (Lemmy, c/selfhost, 2.5.0, process tree, no clients, 60 s settle). We saw a 170.4 MB process-tree sum idle on 2.5.9. The version and settle time differ, and commenters questioned that install, so treat the roughly 34 MB gap as unexplained.
- Slim being "300 to 400 MB smaller". That's disk, from a wiki mirror. Our
docker imagesshowed:2at 2.53GB and:2-slimat 861MB, while idle RAM was 122.7 MiB full vs 125.2 MiB slim (docker stats, run 1, SQLite, idle only).
CPU isn't the limit either: Kuma is designed to use at most one vCPU (maintainer, issue #5726), and ours sat at 0.60% to 1.11%.
Why your Uptime Kuma version matters more than monitor count
Versions 2.2 to 2.5.4 had a TCP-monitor socket leak, and that's where the scary RAM reports come from. The maintainer reproduced it in issue #7537, traced it to a TCP monitor rewrite that didn't always close sockets, and fixed it in 2.5.5 (September 2026, per the releases page).
User reports in that thread (June to September 2026) include about 920 MB of RSS with roughly 4,900 open sockets on 2.5.4, about 6 GB on 2.2.1, and 22.2 GB after 42 hours from one user on a 1 GB VPS (as reported). A single TCP monitor with a TLS certificate check at a 1-second interval grew 150 to 200 MB in 5 minutes; longer intervals slowed the growth.
Our 2.5.9 run had 5 TCP monitors in the mix and RSS rose 3.4 MB in 25 minutes. That fits the fix, but it can't prove there's no slower leak, and the thread confirms one cause, not the absence of others. Check Settings > About before you size anything.
Two setup surprises on a fresh 1 GB box
The full image doesn't pick a database for you, and Ubuntu's firewall blocks Kuma from checking services on its own host.
The database wizard. A fresh louislam/uptime-kuma:2 container starts in "setup database" mode and asks you to choose SQLite, embedded MariaDB or external MariaDB. The full image sets UPTIME_KUMA_ENABLE_EMBEDDED_MARIADB=1; slim doesn't. We skipped the wizard with UPTIME_KUMA_DB_TYPE=sqlite, so every number here is SQLite. MariaDB wasn't measured.
ufw and container-to-host checks. Vultr's Ubuntu 24.04 image has ufw active with only 22/tcp open, and it dropped traffic from the Docker bridge to the host. In our first run every HTTP monitor aimed at the box's own nginx timed out ("timeout of 48000ms exceeded") for 31 minutes, even though ping from the container worked, so we threw that data away. Run 2 added one rule before creating monitors:
ufw allow from 172.17.0.0/16 to any port 80 proto tcpChange the port to the host service you're monitoring; our free firewall rule builder can write the line for you. We only tested targets on the host itself, not external sites.
Keep the 127.0.0.1:3001 binding: ufw logged outside connection attempts within minutes of boot, and we reached the dashboard only through an SSH tunnel. Setup took about 2 minutes (Docker install 51 s, pull 45 s, start about 6 s), and /app/data was 1.2 MB idle, 4.3 MB at 20 monitors and 5.0 MB at the end of the run.
If you're still deciding whether to self-host at all, our self-host vs paid monitoring breakdown covers the cost side.
Who shouldn't run it on 1 GB
The numbers above stop applying if:
- You run a version below 2.5.5 with TCP monitors. That's the #7537 leak. Upgrade first, then size.
- You want to co-host something that peaks above about 400 MB. That's the window low (408 MB available) with Kuma at 110 monitors. Use a 2 GB plan instead.
- You want intervals well under 60 seconds. We only measured 60 s. The fast growth in #7537 was at 1-second intervals on a leaking version, so keep 60 s or longer on 1 GB until you've watched your own RSS.
- You plan to use MariaDB. We have no number for it; budget for 2 GB rather than trusting this post.
- You need proof of week-long stability. This was 25 minutes of steady sampling plus an unexplained swap-out.
Run Uptime Kuma on 1 GB alone; pay for 2 GB if it shares the box
For a dedicated monitor, the 1 GB plan is enough: Uptime Kuma RAM held near 180 MB from 20 to 110 monitors, and 455 MB of the 955 MB stayed available. Run 2.5.5 or later, keep 60-second intervals, choose SQLite, add the ufw rule if you monitor services on the same host, and leave swap on. On a 25 GB disk the slim image is worth a look (about 1.7 GB smaller, near-identical idle RAM in our idle-only check).
If the box also has to run an app with a database, or anything that wants more than about 400 MB, start on Vultr's 2 GB plan and keep the headroom you'd otherwise spend on swap.