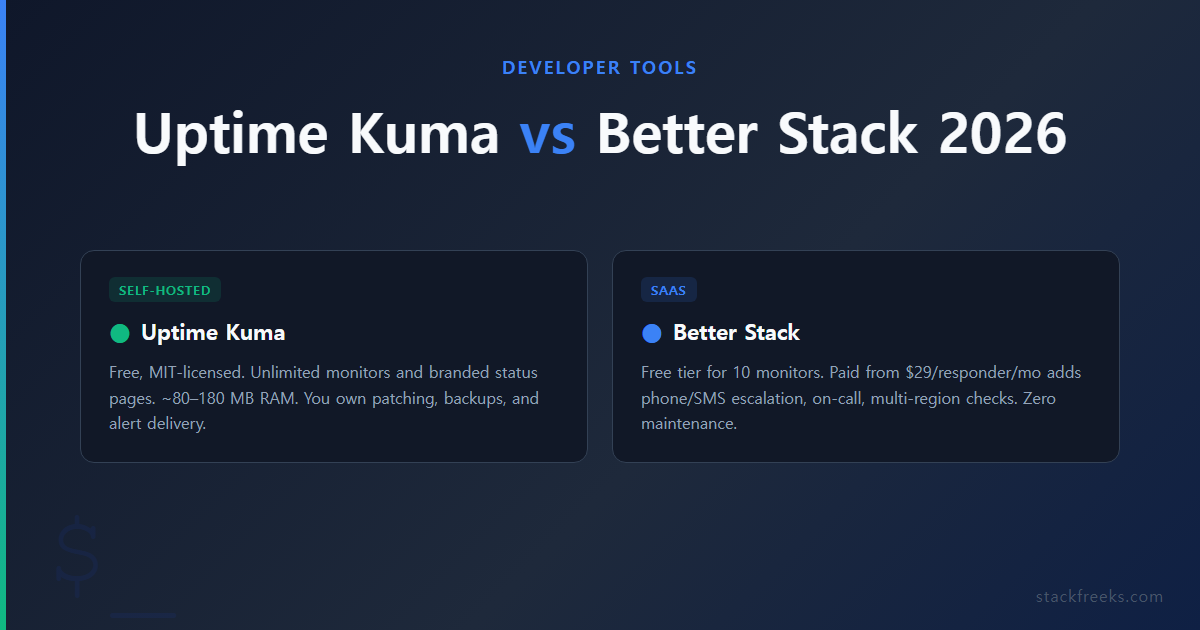
Before you decide to self-host Uptime Kuma instead of paying for a monitoring service, there’s one question that actually settles it: what happens when the thing running your monitor goes down? A free, self-hosted checker looks like an easy win until you’re the one patching it, backing it up, and hoping the alert path still works during an incident. Uptime Kuma is genuinely excellent software, and Better Stack’s free tier is more generous than people expect. The decision comes down to how much a missed alert costs you, and whether anyone on your team wants to own a small server. This post puts concrete 2026 numbers on both sides so you can pick without guessing. It also includes what Uptime Kuma 2.5.5 actually used when we deployed it on a $5/month Vultr instance on September 25, 2026. We measured it on our own test box rather than quoting someone else’s numbers.
The short answer
If you run a side project or homelab, need up/down alerts plus a status page, and don’t mind running a cheap VPS separate from your main app, self-hosted Uptime Kuma is the better pick. The moment you need guaranteed notification delivery, phone or SMS escalation, an on-call rotation, multi-region checks, or SLA reporting for a contract, Better Stack earns its price.
| Situation | Better choice | Why |
|---|---|---|
| Personal projects, homelab, internal dashboards | Uptime Kuma | Free, tiny footprint, unlimited monitors and status pages |
| Free monitoring, no server to manage | Better Stack (free tier) | 10 monitors + 1 status page at $0, zero maintenance |
| Revenue or an SLA depends on catching outages fast | Better Stack (paid) | Phone/SMS escalation, on-call, multi-region, incident timeline |
| You already run a VPS and enjoy the ops work | Uptime Kuma | Marginal cost is near zero if you add an external watchdog |
| Small team with an on-call schedule | Better Stack (paid) | Escalation policies and acknowledge/resolve workflow are built in |
What you actually get with each
Uptime Kuma is an open-source, self-hosted monitor created by Louis Lam and released under the MIT license. It’s a single Node.js application with an embedded SQLite database and a live-updating Vue frontend, shipped as one Docker container. Per the project’s GitHub repo, it’s completely free with no monitor caps, no paid tiers, and no premium-gated features. The current stable line is 2.5.x, with 2.5.3 released in late August 2026 (reporting on the exact patch date varies between sources, but it’s the 2.5.x series). Version 2.5.0 also introduced a supply-chain hardening step: Uptime Kuma now waits roughly two weeks before trusting a newly published npm dependency version, a detail covered by Help Net Security.
Better Stack is a modular observability SaaS. Uptime monitoring is one component; incident management, on-call scheduling, logs, traces, and infrastructure metrics are separate products you turn on and pay for individually. That modularity is why its pricing is hard to predict, which is the most common complaint about it on review sites like G2.
What you give up by self-hosting Uptime Kuma: feature breakdown
The feature gaps below come from Better Stack’s own Uptime Kuma comparison. The gaps themselves are accurate, though the framing on a vendor’s comparison page naturally favors paying them, so treat the “verdict” tone there with a pinch of salt.
| Feature | Uptime Kuma | Better Stack |
|---|---|---|
| Price | Free (MIT license) | Free tier, then ~$29/responder/mo (annual) |
| Monitors | Unlimited | 10 free; paid adds packs (~$21 per 50, annual) |
| Minimum check interval | 20 seconds | 3 minutes (free) / 30 seconds (paid) |
| Check locations | Single location (the server it runs on) | Multiple global locations (paid) |
| Monitor types | HTTP/S, TCP, UDP, DNS, ping, SSL/domain expiry, keyword, push, Docker, database | HTTP/S, TCP, ping, keyword, plus synthetic browser tests (add-on) |
| Notification channels | 90+ integrations | Slack/email (free); phone/SMS (paid) |
| On-call scheduling / escalation | No | Yes (paid) |
| Incident timeline / acknowledge-resolve | No | Yes (paid) |
| Status pages | Unlimited, custom domain, custom CSS, all free | 1 free; extra pages and white-label are pricey add-ons |
| High availability / failover | No | Managed by the vendor |
| Maintenance burden | You own patching, backups, TLS, alert delivery | None |
Pricing last verified: 2026-09-10.
Two things stand out. Uptime Kuma’s 20-second minimum interval is actually faster than Better Stack’s 30-second paid checks and far faster than the 3-minute free tier, a split confirmed by Better Stack’s own docs. And its status pages (unlimited, custom-domain, fully themeable) are a genuine standout, because that’s exactly the feature Better Stack charges the most for.
What Uptime Kuma can’t do
Uptime Kuma has no on-call scheduling or escalation policies, so there’s no “if nobody acknowledges in five minutes, call the next person.” There’s no incident management either: a failed check gives you a notification and nothing else to work with, so there’s no timeline, no acknowledge/resolve workflow, and no postmortem record.
It has no native phone-call alerting. You can bolt on a third-party SMS gateway (the 2.5.x releases keep adding gateway providers), but there’s no built-in voice escalation. Checks originate only from the single server it runs on, so you can’t tell “the site is down” apart from “our one VPS’s route to the site is down,” and there’s no geographic latency view.
The big structural limit is high availability. Uptime Kuma stores its data in a single SQLite file on local disk, which, per an open GitHub issue on HA setup, rules out supported multi-node deployments. There’s no replication and no automatic failover. If the instance dies, your monitoring dies with it, silently.
Finally, there’s no formal SLA reporting. The dashboard shows uptime percentages and response-time graphs, but there’s no historical SLA breakdown or export aimed at customer reporting. If you need to prove “99.9% uptime this quarter” to a client, you’ll be doing that math yourself. The quick calculator below converts a target percentage into the downtime it actually allows.
SLA downtime calculator
Enter an uptime target to see how much downtime it allows.
Per day
–
Per week
–
Per month
–
Per year
–
Month = 365 days / 12 (about 30.4 days). Year = 365 days.
(function () { var root = document.getElementById(“sf-sla-calc”); if (!root) { return; } var input = root.querySelector(“#sf-sla-input”); var err = root.querySelector(“#sf-sla-err”); var outs = root.querySelectorAll(“.sf-v”); var btns = root.querySelectorAll(“.sf-presets button”); function fmt(s) { var t = Math.round(s * 10) / 10; if (t >= 3600) { var m = Math.round(t / 60); var h = Math.floor(m / 60); if (h >= 24) { return Math.floor(h / 24) + “d ” + (h % 24) + “h ” + (m % 60) + “m”; } return h + “h ” + (m % 60) + “m”; } if (t >= 60) { return Math.floor(t / 60) + “m ” + (Math.round((t % 60) * 10) / 10) + “s”; } return t + “s”; } function update() { var raw = String(input.value).replace(“,”, “.”); var v = parseFloat(raw); var ok = !isNaN(v); if (ok) { ok = v >= 0; } if (ok) { ok = v <= 100; } var i; for (i = 0; i !== btns.length; i++) { btns[i].className = (ok ? parseFloat(btns[i].getAttribute("data-v")) === v : false) ? "sf-on" : ""; } err.textContent = ok ? "" : "Enter a number between 0 and 100."; for (i = 0; i !== outs.length; i++) { outs[i].textContent = ok ? fmt(parseFloat(outs[i].getAttribute("data-p")) * (100 – v) / 100) : "-"; } } for (var j = 0; j !== btns.length; j++) { btns[j].addEventListener("click", function () { input.value = this.getAttribute("data-v"); update(); }); } input.addEventListener("input", update); update(); })();For more options, use the full SLA uptime calculator on StackFreeks Tools.
Resource footprint: how little it really needs
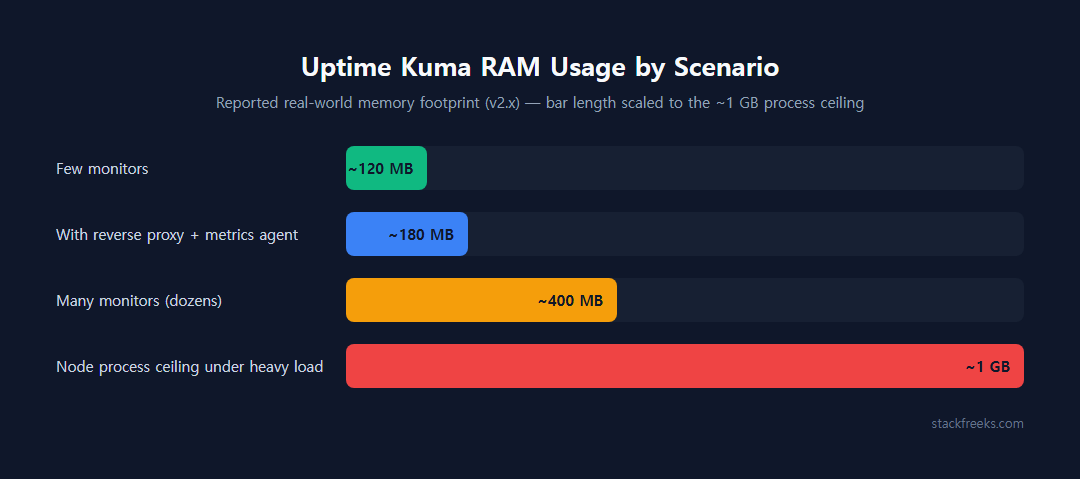
Reported real-world usage varies with monitor count, but it’s consistently small:
- One operator running only Uptime Kuma on a 256 MB VPS reported roughly 170 MB of total system memory in use (LowEndTalk thread).
- Another summary puts the v2.x process at roughly 80-120 MB RAM depending on monitor count, with CPU that “barely registers.”
- A combined stack (Uptime Kuma plus a lightweight metrics agent behind a reverse proxy) came in around 150-180 MB total on a 1 GB VPS (Virtua Cloud tutorial).
- A higher estimate from one source puts it near 400 MB RAM and up to ~5% of a CPU core at peak with many monitors.
- A GitHub issue notes the Node process effectively caps memory growth around 1 GB even under heavy load.
So: budget 80-180 MB for a normal setup, expect it to climb toward a few hundred MB if you’re running dozens of monitors, and know the ceiling is around 1 GB. On our own fresh 2.5.5 install the container sat slightly above that range (184.3 MiB idle and 196 MiB with three monitors, details in the next section), so plan for roughly 200 MB with current v2 builds. Practical guidance that comes up repeatedly: 256 MB runs a handful of monitors, and 512 MB to 1 GB is comfortable for dozens plus a reverse proxy like Caddy, Nginx, or Traefik. If you’re sizing the container itself, our Docker RAM calculator helps you set sane limits.
Setup is a single docker run (or a short compose file) with one persistent volume for /app/data, then you create the admin account in the browser. Adding TLS means putting a reverse proxy in front, which takes a few more minutes with Caddy. If you’ve set up a container on a VPS before, none of this is new; our Deploy Docker on Vultr VPS guide covers the same groundwork.
What Uptime Kuma 2.5.5 actually used on a $5 Vultr instance
The numbers above come from other people’s setups, so we ran our own. On September 25, 2026, we deployed Uptime Kuma on a fresh Vultr Regular Performance instance in Tokyo: the $5/month plan with 1 vCPU, 1 GB RAM, and a 25 GB SSD, running Ubuntu 24.04 (the plan also ships with a 2.4 GB swap file). We installed Docker with the official get.docker.com script, then started the container with this exact command:
docker run -d --restart=unless-stopped -p 3001:3001 -v uptime-kuma:/app/data --name uptime-kuma louislam/uptime-kuma:2The :2 tag pulled app version 2.5.5. We picked SQLite at the first-run database prompt, created the admin account, and added three HTTP monitors at the 20-second minimum interval. Every figure below is a reading from that box, taken with docker stats, free -m, and df -h.
| What we measured | Result |
|---|---|
| Docker install (get.docker.com script) | 42 s (Docker 29.8.1) |
docker run to reachable web UI, including image pull | 58 s |
Image size (louislam/uptime-kuma:2) | 2.49 GB |
| Container RAM, idle, before any monitors | 184.3 MiB (CPU 0.03%) |
| Container RAM, 3 HTTP monitors at 20 s | 196 MiB (CPU 0.82%) |
Whole-host memory used (free -m), 3 monitors running | 518 MB of 955 MB |
Disk used: OS, Docker, and image (df -h /) | 8.9 GB of 23 GB usable |
Three things in that table matter more than the rest. First, the image is the heavy part, not the process: 2.49 GB is about a tenth of the plan’s 25 GB disk, so on the cheapest tiers leave room for image updates, which temporarily keep the old image around until you prune it. Second, RAM stayed under 200 MiB with three monitors, and the whole host (OS, Docker daemon, and Kuma) used 518 MB of the 955 MB the kernel reports, so a 1 GB plan has real headroom. Third, the software part of setup is fast: about 100 seconds from a bare OS to a login page. The 30-60 minute setup estimate further down is mostly the reverse proxy, TLS, and notification wiring, which we didn’t do on this test box.
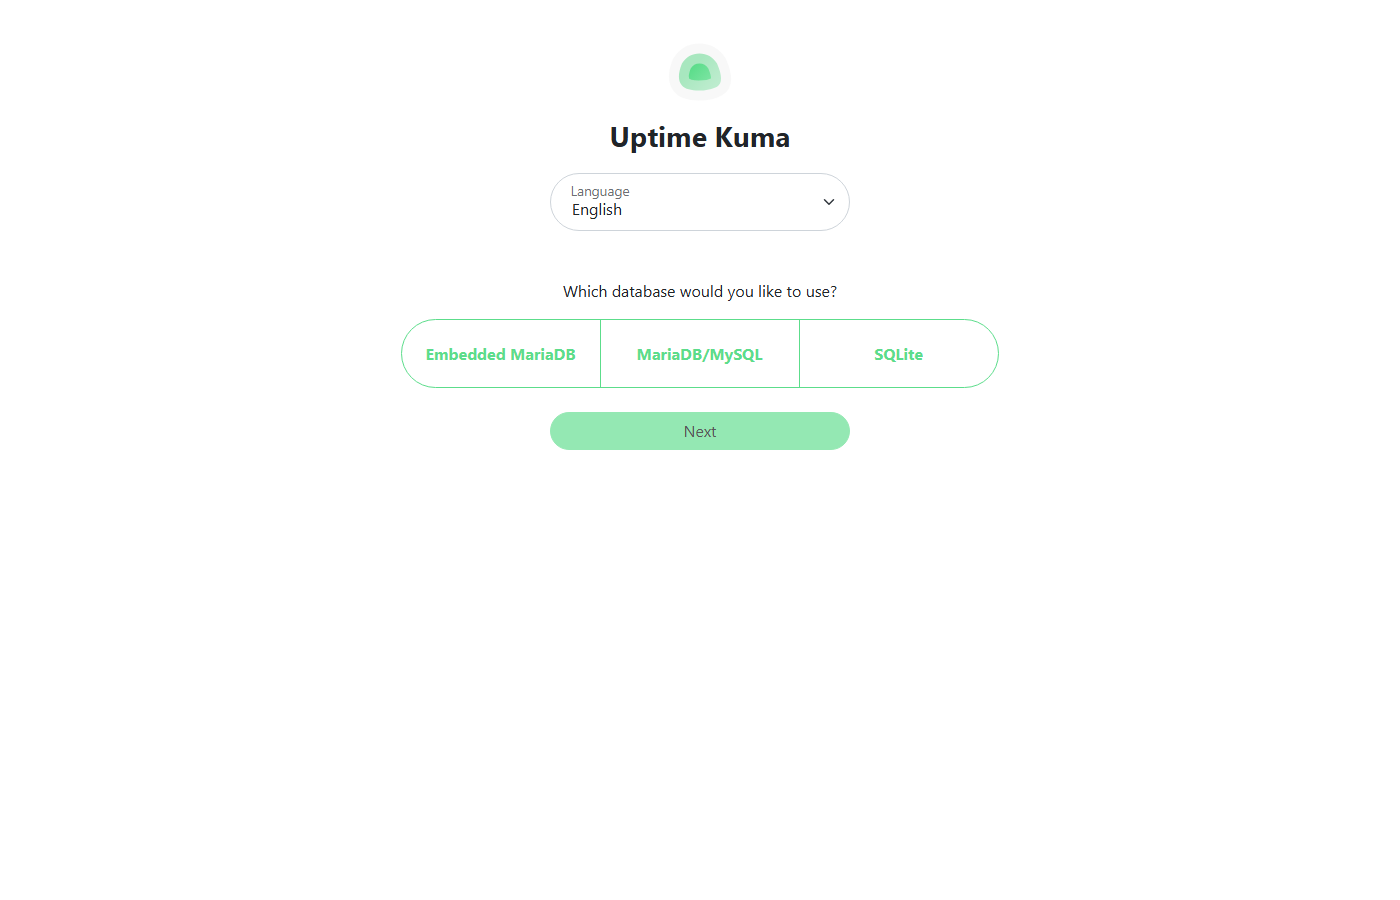
That database prompt is new in the v2 line and easy to click through without thinking. SQLite keeps everything in one file inside the /app/data volume, with no extra database process eating memory, which makes it the right fit for a 1 GB box. Embedded MariaDB runs a MariaDB server inside the container, which adds memory overhead you don’t need for a handful of monitors, and the external MariaDB/MySQL option only makes sense if you already run a database server. SQLite also keeps backups simple: stop the container and copy one volume.
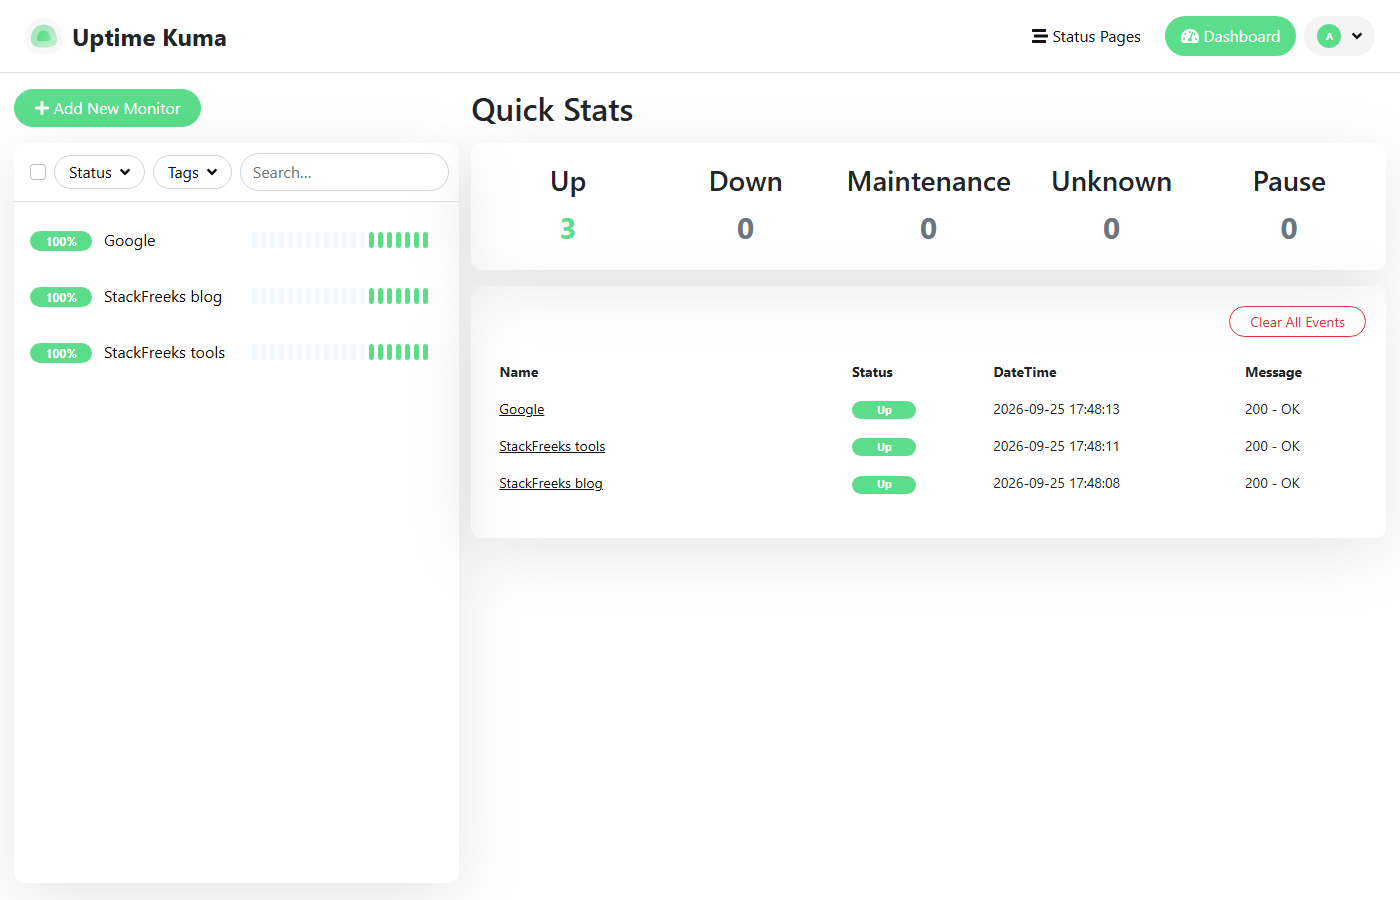
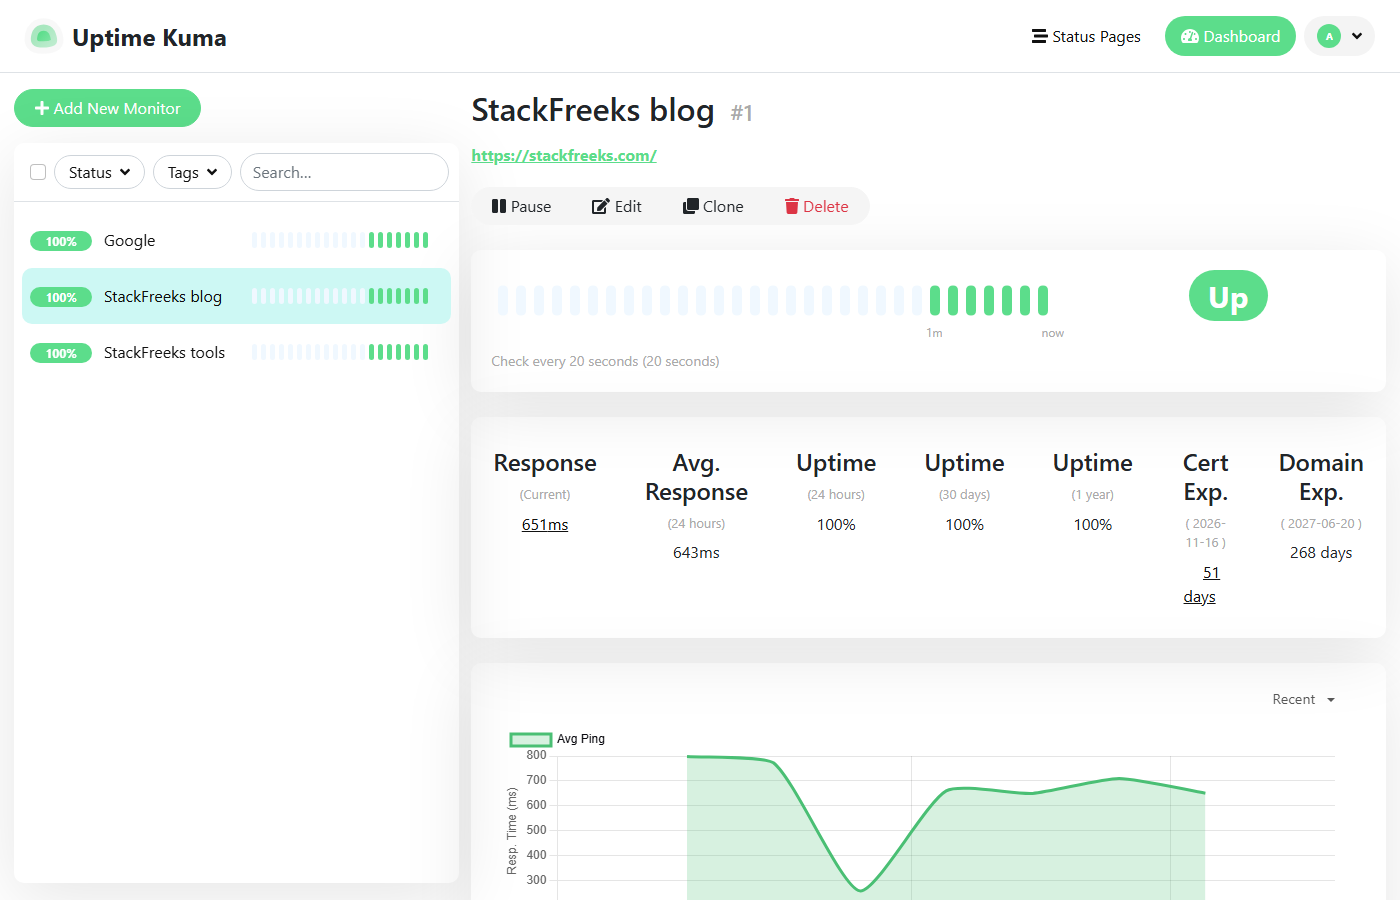
One limit on all of this: we ran the instance for minutes, not days. These are first-boot and light-load numbers, not a long-term reliability or memory-growth test, and three monitors is a small load. The sourced reports above are the better guide for how memory behaves with dozens of monitors over months. If you copy the command, note that -p 3001:3001 publishes the dashboard on every interface, so firewall it or put a reverse proxy in front before you add real monitors.
Better Stack pricing in 2026
Better Stack bills each product separately, so your bill depends entirely on what you switch on. The figures below come from third-party pricing breakdowns dated mid-2026 (Hyperping, findstack, CubeAPM); confirm against betterstack.com/pricing before you commit, since SaaS pricing drifts.
Free tier ($0): 10 monitors plus 10 heartbeat/cron monitors, 1 status page, 3-minute checks, and Slack and email alerts. For a lot of side projects, that’s genuinely enough.
Responder license ($29 per responder per month on annual billing, about $34 month-to-month for the same license): billed per on-call user, with unlimited free viewers. This unlocks 30-second checks from multiple global locations, unlimited phone and SMS alerts, on-call scheduling, escalation policies, and incident management.
Status page add-ons, where the bill balloons: extra status pages run about $12-15 per page per month, custom CSS/JS is similar, and white-labeling (removing Better Stack branding) is around $208-250 per page per month. A custom email domain for a status page is in the same $208-250 range.
Telemetry bundles (logs, traces, metrics): separate again, starting around $25/month for the smallest bundle and climbing to $400+ for large volumes, with pay-as-you-go rates as an alternative. US pricing runs roughly 15-20% above the headline euro figures.
Here’s an illustrative mid-market setup to show how fast it adds up: 3 responders with advanced workflows ($114) + 100 monitors ($42) + a mid-tier telemetry bundle ($100) + 2 white-labeled status pages with custom domains ($416) + extra status-page subscribers ($80) lands near $752/month, roughly $9,000/year. A solo developer who just wants fast checks, phone alerts, and one status page realistically pays the single $29/month responder license.
The real cost of self-hosting Uptime Kuma
“Free” software still needs somewhere to run.
Infrastructure: one small VPS. In 2026, budget options include Hetzner Cloud from around €4/month, Vultr from $5/month (or a smaller $2.50-3.50 tier), and DigitalOcean droplets at $4-6/month. Call it about $5/month, or $60/year. New Vultr accounts get $300 in free credit valid for 30 days, which covers a long test run before you pay anything. Vultr is a reasonable default here, and our Best Cheap VPS Under $10/Month and Vultr vs Hetzner comparisons cover the alternatives.
Time: roughly 30-60 minutes for initial setup (Docker, reverse proxy, TLS, first monitors), then 10-20 minutes a month for updates and a periodic check that backups actually restore. Add irregular time when a Docker or Node upgrade breaks something or the disk fills.
Hidden costs: you now own OS patching, the SQLite backup, TLS renewal (mostly automatic with Caddy), and verifying that notifications still deliver (the one people forget). Telegram bot tokens and webhook secrets expire, and SMTP relays get blocked. You find out during an incident.
The break-even math: Uptime Kuma’s ~$5/month VPS is more expensive than Better Stack’s $0 free tier for the basic case. Self-hosting only pulls ahead on price when you’d otherwise be paying for Better Stack’s $29/month tier and you genuinely don’t need what that tier provides. Against paid Better Stack, self-hosting saves about $280/year, minus the value of your time.
When self-hosting monitoring is a false economy
Monitoring has one structural problem that no other self-hosted service has: the watcher must not share a fate with the thing it watches.
If Uptime Kuma runs on the same server, provider, or region as your app, a provider outage takes down both your app and your ability to know about it. Even on a separate VPS, that VPS has no monitor of its own, so you need an external heartbeat pinging your Kuma instance, whether that’s a free UptimeRobot or Better Stack check, or a cron push from another host. The valebyte writeup on self-hosted monitoring makes this the core recommendation: run it on a different provider from your main infrastructure, plus an external watchdog.
The other traps: no HA means a disk-full event or a bad upgrade silently ends monitoring until you happen to notice. Your alert path is exactly as reliable as one SMTP relay or one Telegram token, where a SaaS runs redundant SMS and voice carriers. And single-location checks can’t distinguish a real outage from a routing problem between your VPS and the target.
Self-hosting is defensible when it’s a side project, homelab, or internal dashboard; downtime costs little; you already run a VPS and enjoy the ops; and you add that external watchdog. It’s a false economy when revenue or an SLA depends on catching outages fast, when you need someone woken by a phone call, when you have an on-call rotation, or when nobody on the team wants to own patching and backups.
Who should choose which
Choose self-hosted Uptime Kuma if you’re a solo developer or small team running side projects, you want unlimited monitors and unlimited branded status pages for free, you’re comfortable with Docker and a reverse proxy, and you’ll commit to running it on a separate provider with an external heartbeat. Reddit’s r/selfhosted and LowEndTalk communities are broadly positive on it for exactly this use (clean UI, trivial setup, “set and forget” behavior), with the recurring caveat that it’s single-node, so people run it off-site.
Choose Better Stack’s free tier if you have 10 or fewer things to monitor, 3-minute checks are fine, and you’d rather not manage a server at all. It costs nothing and there’s no maintenance.
Choose Better Stack’s paid tier if you need 30-second multi-region checks, guaranteed phone/SMS escalation, an on-call schedule with escalation policies, or an incident timeline your team works from. At $29/month for a solo responder, it’s cheaper than a part-time ops habit if an hour of your time is worth more than about $25.
Consider managed hosting instead of a raw VPS if you want to self-host Uptime Kuma but don’t want to own the OS. A managed platform like Cloudways (from around $11/month, with a 3-day free trial and 30% off the first 3 months through our link) handles patching and server management while still letting you run your own Docker workloads. It’s a middle ground between full self-hosting and full SaaS. Our Cloudways vs Vultr breakdown covers that trade-off in detail.
Uptime Kuma for side projects, Better Stack when customers are watching
The Uptime Kuma vs Better Stack decision comes down to what a missed alert costs you and who’s willing to own a server. If you’re running side projects or a homelab and downtime just means an annoyed weekend, self-host Uptime Kuma on a cheap VPS from a provider separate from your main app, add an external heartbeat, and enjoy unlimited monitors and status pages for the price of a $5 droplet. Our own $5 test instance ran three monitors at under 200 MiB of RAM, so the part that needs planning is the external watchdog, not the server size. Start with Vultr’s $300 free credit if you want to test before paying.
If a customer, a contract, or an on-call rotation is involved, stop trying to save $29 a month. Better Stack’s paid tier gives you multi-region checks, phone escalation, and an incident workflow that a self-hosted checker structurally can’t match. Its free tier is the right call for anyone who wants zero-maintenance monitoring of a handful of endpoints. The worst outcome is self-hosting your monitoring, skipping the external watchdog, and discovering during an outage that the watcher went down first.