This post contains affiliate links. If you purchase through our links, we may earn a commission at no extra cost to you.
Vultr’s checkout screen makes this decision look trivial: pick Regular Performance at roughly $6/month or bump to High Frequency for about a dollar more. But “just pay the extra dollar” isn’t the same as “it’s obviously worth it” — and when I actually went looking for hard data on Vultr Cloud Compute vs High Frequency, I found two 2026 reviews of the exact same plan reaching opposite conclusions. One grades High Frequency’s CPU an F. The other says it beats Vultr’s pricier tiers outright. Both can’t be fully right, and figuring out why is more useful than repeating either one blindly. So on 2026-09-25 we also ran all three entry tiers side by side in Vultr’s Tokyo region: High Frequency clearly beat Regular on disk, but the same-priced High Performance AMD plan beat both on single-thread CPU and sequential writes.

Vultr Cloud Compute vs High Frequency: What Actually Changes
Vultr’s Cloud Compute line has three “classic” shared-vCPU tiers, plus a new fourth tier that most comparison posts haven’t caught up to yet. Regular Performance — what Vultr used to just call Cloud Compute — runs on previous-generation Intel CPUs with regular SATA SSD storage. It’s the budget option: fine for a personal blog, a staging environment, or a Discord bot that doesn’t need to think fast.
High Frequency swaps in 3GHz+ Intel Xeon CPUs exclusively (no AMD option here) plus NVMe SSD, and Vultr markets it specifically for WordPress hosting, small game servers, and anything where single-thread clock speed matters more than raw core count. It also ships with more storage than High Performance at the same price point, though you get less bandwidth in return.
High Performance sits in between on positioning but not necessarily on power — it runs newer AMD EPYC or Intel Xeon silicon clocked at 4GHz+, still on NVMe, with the most included bandwidth of the three. Looking at Vultr’s tier lineup as a whole (see our Vultr Review 2026), the naming here is genuinely confusing — “High Performance” doesn’t automatically outperform “High Frequency” in every metric, and the benchmarks below show exactly why that matters.
The Benchmarks Don’t Fully Agree — Even With Themselves
The most complete public benchmark I could find is joshtronic’s January 2025 four-way sysbench comparison, testing Regular, High Frequency, High Performance AMD, and High Performance Intel on identical 1 vCPU/1GB instances in the same region. The raw numbers:
| Benchmark | Regular | High Frequency | High Performance AMD | High Performance Intel |
|---|---|---|---|---|
| CPU events/sec | 844.61 | 1,339.47 | 2,620.69 | 1,013.26 |
| Memory read ops/sec | 4.14M | 6.63M | 3.83M | 4.76M |
| MySQL reads/sec | 64,714 | 115,152 | 69,627 | 72,992 |
| File I/O fsyncs/sec | 4,403 | 9,103 | 3,309 | 5,897 |
Here’s the part worth flagging honestly: the article’s own conclusion says High Frequency “shined in every category” — but its own table shows High Performance AMD scoring almost double High Frequency’s raw CPU throughput (2,620.69 vs. 1,339.47 events/sec). High Frequency does win on memory ops, MySQL reads, and fsyncs, so it’s not a bad instance. It just isn’t the flat CPU winner the prose claims, and I’d rather point that out than repeat a conclusion the author’s own data doesn’t fully support.

The disagreement gets worse once you look at 2026-specific reviews. HostingEngines’ March 2026 WordPress-load testing found High Frequency modestly ahead of both High Performance variants — a 0.798-second WPPerformanceTester load time versus 0.904 seconds for AMD and Intel High Performance, and a GTmetrix score of 0.616 seconds versus 0.736 for High Performance Intel (though High Performance AMD actually edged it out at 0.565 seconds on that specific test). Their takeaway: High Frequency is the better buy for WordPress despite its older 3GHz+ chips.
HostingTags’ 2026 audit of the same High Frequency 1GB plan tells a different story. Under sustained-load testing, they gave it a CPU grade of F (“despite the 3.7GHz clock speed, the instance struggled with sustained compute-heavy tasks”), plus a D on web performance and D on network transfer. Their verdict: not worth the premium for anything beyond dev sandboxes or static sites.
Both reviews are dated 2026 and tested the same product. The likely explanation is methodology, not a bad instance or a fluke: HostingEngines measured bursty page-load performance — the kind of short CPU spike a WordPress request actually generates — while HostingTags stress-tested sustained compute. If your workload looks like WordPress traffic (short bursts, mostly I/O-bound), High Frequency’s numbers look fine. If it looks like a render queue, a compile job, or anything that pins the CPU for more than a few seconds, the F grade is the more relevant data point. Treat “is High Frequency worth it” as workload-dependent, not a universal yes or no — because the two most recent tests of the same plan genuinely disagree.
Our Own Test: Regular vs High Frequency vs High Performance AMD in Tokyo
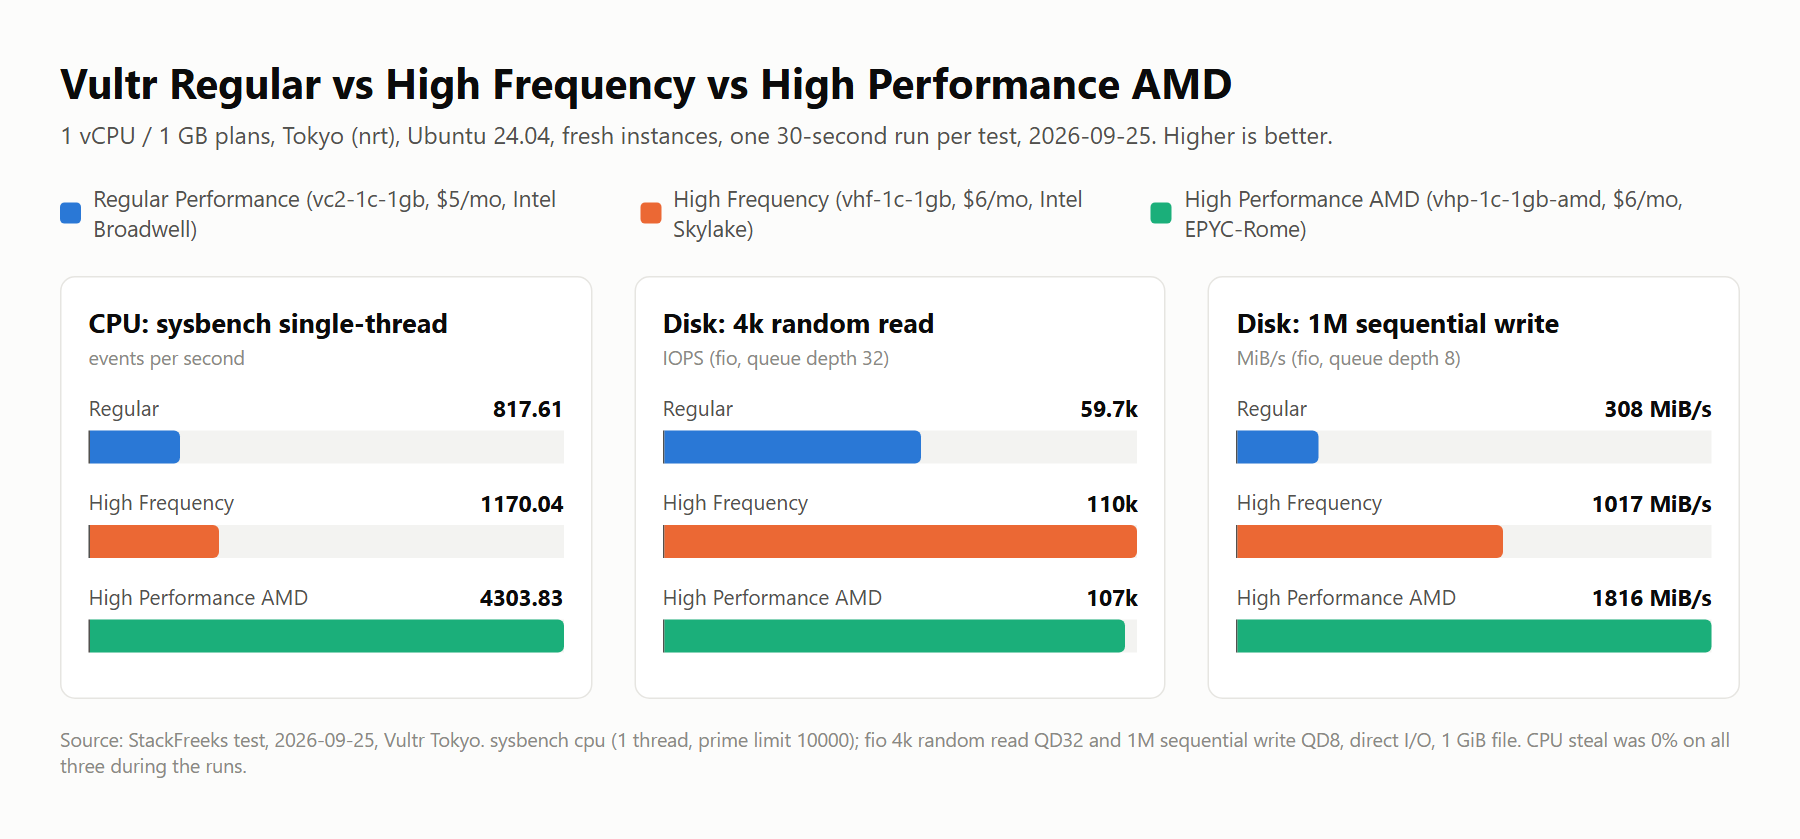
Since the published reviews disagree, we ran the three entry tiers side by side ourselves. On 2026-09-25 we created three fresh 1 vCPU / 1GB instances in Vultr’s Tokyo (nrt) region, all on Ubuntu 24.04: Regular Performance (vc2-1c-1gb, $5/month), High Frequency (vhf-1c-1gb, $6/month), and High Performance AMD (vhp-1c-1gb-amd, $6/month). The same script ran on all three at the same time, and each benchmark ran exactly once for 30 seconds. That makes this one short sample from one region on one day — useful for comparing the tiers against each other, not a claim about how any of them behave over weeks.
lscpu | grep -E 'Model name|^CPU\(s\)|Hypervisor vendor'
vmstat 1 30; mpstat -P ALL 1 10    # idle; vmstat repeated under sysbench load
sysbench cpu --threads=1 --time=30 run
fio --name=rr --filename=/root/fio.test --size=1G --rw=randread --bs=4k --iodepth=32 --ioengine=libaio --direct=1 --runtime=30 --time_based --group_reporting
fio --name=sw --filename=/root/fio.test --size=1G --rw=write --bs=1M --iodepth=8 --ioengine=libaio --direct=1 --runtime=30 --time_based --group_reporting| Plan (monthly price) | CPU reported by lscpu | sysbench CPU, 1 thread (events/sec) | fio 4k random read, QD32 (IOPS) | fio 1M sequential write (MiB/s) | CPU steal, idle / under load |
|---|---|---|---|---|---|
| Regular Performance, vc2-1c-1gb ($5) | Intel Core Processor (Broadwell) | 817.61 | 59.7k | 308 | 0% / 0% |
| High Frequency, vhf-1c-1gb ($6) | Intel Core Processor (Skylake) | 1,170.04 | 110k | 1,017 | 0% / 0% |
| High Performance AMD, vhp-1c-1gb-amd ($6) | AMD EPYC-Rome Processor | 4,303.83 | 107k | 1,816 | 0% / 0% |
Our test: Vultr Tokyo (nrt), Ubuntu 24.04, fresh instances, one 30-second run per benchmark, 2026-09-25. Steal is the vmstat st column (30 one-second samples idle, 30 under sysbench load) plus mpstat %steal while idle.
The relevant lines from the raw output, trimmed:
## High Frequency (vhf-1c-1gb)
Model name:                              Intel Core Processor (Skylake, IBRS, no TSX)
    events per second:  1170.04
  read: IOPS=110k, BW=432MiB/s (452MB/s)(12.6GiB/30001msec)
  write: IOPS=1017, BW=1017MiB/s (1067MB/s)(29.8GiB/30009msec); 0 zone resets
# vmstat during sysbench load (us=100, st=0):
 r  b   swpd   free   buff  cache   si   so    bi    bo   in   cs us sy id wa st gu
 1  0    268 101408  22916 648496    0    0     0     0 1008   53 100  0  0  0  0  0

## Regular Performance (vc2-1c-1gb)
Model name:                              Intel Core Processor (Broadwell, no TSX, IBRS)
    events per second:   817.61
  read: IOPS=59.7k, BW=233MiB/s (244MB/s)(6994MiB/30001msec)
  write: IOPS=307, BW=308MiB/s (323MB/s)(9237MiB/30029msec); 0 zone resets

## High Performance AMD (vhp-1c-1gb-amd)
Model name:                              AMD EPYC-Rome Processor
    events per second:  4303.83
  read: IOPS=107k, BW=418MiB/s (438MB/s)(12.2GiB/30001msec)
  write: IOPS=1816, BW=1816MiB/s (1904MB/s)(53.2GiB/30003msec); 0 zone resets
High Frequency beat Regular clearly on disk: 110k vs 59.7k random-read IOPS (1.84x) and 1,017 vs 308 MiB/s sequential write (3.3x). On CPU the gap was moderate — 1,170.04 vs 817.61 events/sec, about 43% more. That’s what the extra dollar actually bought in this run, and it fits the NVMe-versus-older-storage difference described above.
The bigger surprise is the plan at the same price. High Performance AMD costs the same $6/month as High Frequency and scored 4,303.83 events/sec (3.68x High Frequency) and 1,816 MiB/s sequential write (1.79x), while matching it on random reads (107k vs 110k IOPS — too close to separate with one run). One caveat on that CPU figure: sysbench’s prime-number test rewards newer CPU generations heavily, and EPYC-Rome is a newer design than the Skylake and Broadwell parts the other two plans reported. It’s one synthetic metric, not a prediction of how fast your PHP or Node app will run.
How this squares with the sources above: joshtronic’s January 2025 run had the same order (844.61 / 1,339.47 / 2,620.69 events/sec for Regular / High Frequency / High Performance AMD), with our High Frequency result lower and our High Performance AMD result higher — a spread you’d expect across different hosts, regions and dates. And our 0% steal under a 30-second load doesn’t contradict HostingTags’ sustained-load F grade for High Frequency; a half-minute test on a fresh instance simply can’t show what happens over hours on a busy host.
To turn those numbers into a pick, the widget below uses only the measured results in the table and the three monthly prices.
Which $5–$6 Vultr plan fits my workload?
Uses only our measured results (Tokyo, 2026-09-25, one 30-second run per test) and the monthly price of each plan.
| Plan | Measured | Per $1/mo | Monthly cost |
|---|---|---|---|
| Regular Performance ($5)Best pick | – | – | – |
| High Frequency ($6)Best pick | – | – | – |
| High Performance AMD ($6)Best pick | – | – | – |
For other plan sizes and providers, our free VPS cost calculator runs the monthly math for a whole fleet.
VX1: The Tier Most Comparison Posts Are Missing
While joshtronic’s benchmark and older posts on this exact topic were being written, Vultr quietly added a fourth Cloud Compute tier. VX1, launched October 21, 2025, runs on the latest AMD EPYC-Turin processors with dedicated (not shared) vCPU cores, up to 50 Gbps networking, and either boot-from-NVMe or Block Storage — plus provisioning Vultr claims takes under 15 seconds.
Vultr’s own marketing claims VX1 delivers up to 82% better performance-per-dollar than leading hyperscaler cost-efficiency plans and a 33% cost-effectiveness increase per vCPU versus its own existing dedicated Optimized Cloud Compute line. Take the specific percentages with the usual grain of salt you’d apply to any vendor’s own benchmark — but the direction is corroborated by at least one independent source: Hyperframe Research’s Steven Dickens noted that “price wars are simple; price-to-performance wars require sustained engineering execution,” a fair caveat that VX1’s advantage needs to hold up over several quarters, not just at launch. He also cited a Nucleus Research figure that organizations switching to Vultr generally saw 30–60% cost reductions versus traditional hyperscalers — a general Vultr data point, not VX1-specific, but it’s outside corroboration rather than Vultr’s own claim.
VPSBenchmarks.com’s cross-tier grading backs up the idea that VX1 is the more meaningful upgrade path: the $6–$12/mo bracket (Regular, High Performance, High Frequency) scored a flat F on raw CPU power across the board in their testing, while VX1 configurations scored C on CPU and up to B or A on web performance, disk I/O, and stability. If you’re actually chasing performance rather than just avoiding the worst option, VX1 — not the jump from Regular to High Frequency — is the upgrade that shows up in the data. We cover the bare-metal end of that upgrade path in Vultr Bare Metal vs Cloud Compute if you need to go further still.
The catch: VX1 is currently New Jersey-only, has no automated backups, and doesn’t support Windows. It also starts around $43.80/month for 2 vCPU/8GB (one tracker listed a 2C/8G/50GB config at $48.80/mo, likely with a storage line item added in) — a different price bracket entirely from the $6/month tiers this article is mainly about.

Vultr Cloud Compute vs High Frequency Pricing in 2026
Vultr renders its pricing page dynamically, and third-party trackers don’t always agree on the exact entry-tier number — I’ve seen Regular Performance’s smallest instance quoted anywhere from $2.50 to $5/month depending on which RAM configuration a given site is summarizing. Treat the figures below as a verified range as of this writing, and check Vultr’s Pricing 2026 breakdown or Vultr’s own live pricing page for the exact current number before you buy.
| Tier | Entry spec | Entry price | 2 vCPU / 4GB price | CPU | Storage | Bandwidth |
|---|---|---|---|---|---|---|
| Regular Performance | 1 vCPU / 0.5–1GB | ~$2.50–$5/mo | ~$22/mo | Previous-gen Intel (shared) | Regular SSD | 3 TB |
| High Performance | 1 vCPU / 1GB | $6/mo | ~$24–26/mo | AMD EPYC / Intel Xeon, 4GHz+ | NVMe SSD | 5 TB |
| High Frequency | 1 vCPU / 1GB | $6/mo (2GB ~$12/mo) | Comparable to High Performance | Intel Xeon only, 3GHz+ | NVMe SSD | 2–5 TB (less than High Performance) |
| VX1 | 2 vCPU / 8GB | ~$43.80/mo | 4 vCPU/16GB ~$110.16/mo | AMD EPYC-Turin, dedicated vCPU | NVMe or Block Storage | Up to 50 Gbps |
Prices last checked: 2026-07-03
So the “$1 more” framing in this article’s title is close but not exact — at the 1GB tier, Regular Performance and High Frequency can land at the same $6/month depending on which configuration you’re comparing, with the real difference showing up more clearly once you move to 2GB and up. Either way, the actual gap you’re paying for is 3GHz+ Xeon plus NVMe versus older Intel silicon plus SATA SSD — not a flat, evergreen dollar figure.
If you want to settle this for your own workload instead of trusting either benchmark blindly, Vultr currently gives new accounts $300 in free credit, valid for 30 days — more than enough to spin up a Regular, High Frequency, and even a VX1 instance side by side and run your own load test before committing a dime. We broke down whether that credit is actually worth claiming in Vultr’s $300 Free Credit 2026 review.
Which One Should You Actually Pick?
- Running WordPress, a small forum, or a single-thread-sensitive app: High Frequency is the safer default. HostingEngines’ 2026 WordPress-specific tests favor it, and Vultr’s own product positioning backs that use case. If you’re specifically shopping for a WordPress box, our Best VPS for WordPress 2026 roundup covers more than just Vultr’s tiers.
- Running a personal project, staging site, or dev sandbox with no real traffic: Regular Performance is fine, and paying extra for High Frequency here is money you won’t notice the benefit of.
- Running sustained compute — video encoding, batch jobs, CI runners, anything that pins a core for more than a few seconds: High Performance AMD is the better bet based on joshtronic’s raw CPU numbers, and HostingTags’ sustained-load results actively argue against High Frequency for this use case.
- Actually chasing performance, not just avoiding the cheapest option: Skip the $6/month bracket entirely and look at VX1, understanding you’re now New Jersey-only with no automated backups and a starting price closer to $44/month.
Every one of these bands has a real downside worth naming: Regular Performance will bottleneck under real traffic, High Frequency’s sustained-load performance is genuinely disputed between reviewers, High Performance AMD gives up some storage and clock-speed marketing appeal for raw throughput, and VX1’s region lock and missing backups are dealbreakers for some setups regardless of the price-performance numbers.
High Frequency Pays Off for Bursty Sites
Weighing Vultr Cloud Compute vs High Frequency one more time: for a WordPress site, a forum, or anything bursty rather than sustained, I’d take High Frequency over Regular Performance — the NVMe storage and clock speed show up in real page-load numbers, even if the CPU-stress benchmarks are messier than either reviewer admits. If your workload is sustained compute instead, spend the same money on High Performance AMD and get the throughput the joshtronic numbers actually support. And if you’ve outgrown the $6/month bracket entirely, VX1 is the upgrade with real benchmark backing behind it — just confirm the New Jersey region and missing backups aren’t dealbreakers first. Our own Tokyo run on 2026-09-25 backs the High Frequency-over-Regular call on disk (110k vs 59.7k IOPS), but it also makes High Performance AMD hard to ignore at the same $6 — it led on single-thread CPU and sequential writes in that single test, so check whether it’s offered in your region before defaulting to High Frequency. Given how much the 2026 reviews disagree with each other, the cheapest way to get a real answer is to spin up two instances yourself: Vultr‘s $300 signup credit covers a proper side-by-side test without any of this being a guess.