
If your Vultr Singapore server feels sluggish at certain times of day but fine at others, you’re not imagining it. A Vultr Singapore Slow complaint is one of the most consistent threads on Vultr’s own community forum. LowEndTalk has independent reports of the same thing: one user testing from Indonesia measured roughly 300ms round-trip to Singapore versus a normal ~30ms. It’s a recognized, recurring pattern with an identifiable cause, and there’s a real diagnostic process for figuring out whether it’s Singapore, your ISP, or something else entirely. We also ran that process ourselves on fresh $5 Vultr instances in Singapore and Tokyo on September 25, 2026: in that single run the Singapore server itself was clean (0% loss, 68.0ms to Tokyo), and the bigger differences came from which region sat closer to the destination (the measurements are below).
This post contains affiliate links. If you purchase through our links, we may earn a commission at no extra cost to you.
Is Vultr Singapore actually slow, or is it your connection?
Before blaming the region, rule out the simplest explanation: your own path to it. Run a sustained ping (ping -c 100 [your-server-ip]) from the machine where you’re noticing the slowness. This establishes a baseline round-trip time and packet-loss percentage for your specific route. If you’re seeing 300ms+ or dropped packets consistently, something’s wrong upstream of Vultr; if it’s a clean 20-40ms with occasional spikes, you’re looking at intermittent congestion, not a broken path.
The pattern across every source on this topic (Vultr’s own forum, LowEndTalk, and third-party benchmarks) points the same direction: Singapore latency problems are real but intermittent and route/time-dependent, not a constant, structural failure. One long-term Vultr user reviewing their year on the platform rated overall reliability 5/5 and still noted that their single worst incident was roughly an hour of elevated network latency. A separate benchmark from LetsHosting (dated January 31, 2024) tested a Singapore node directly and found sub-1ms latency to local endpoints and ~36.69ms to Hong Kong, which are solid regional numbers. Both things are true: Singapore performs well most of the time, and it has documented spike events. Your diagnostic job is figuring out which one you’re hitting.
Run a bidirectional MTR to find the real bottleneck
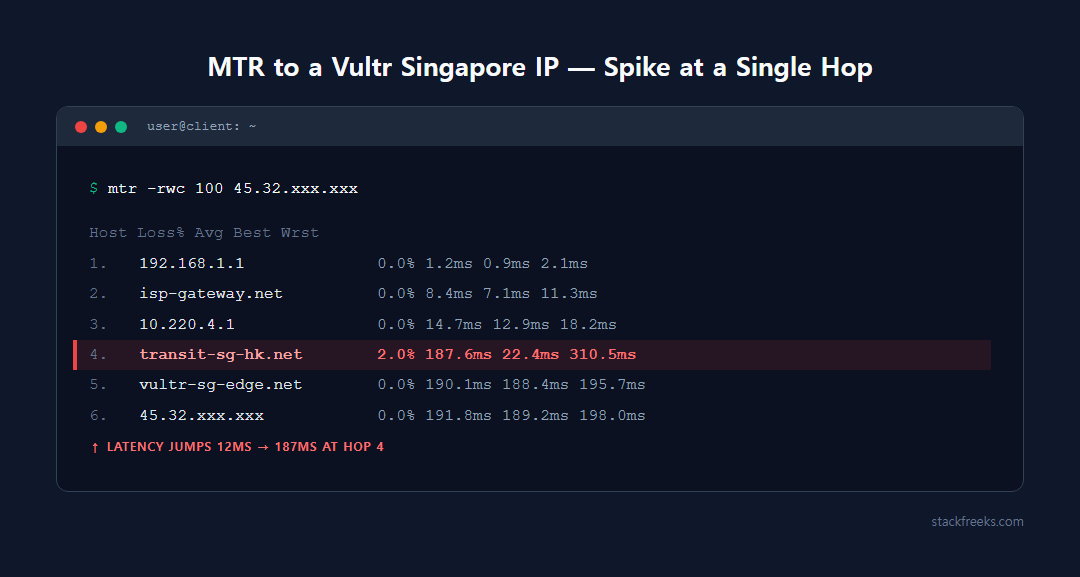
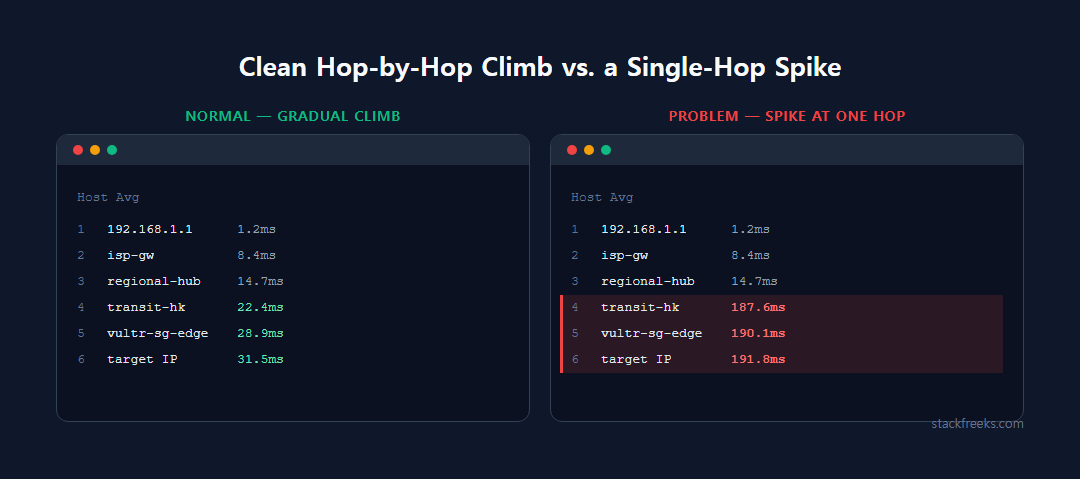
Ping tells you that something’s slow. MTR (My Traceroute) tells you where. It combines traceroute and ping into one continuously-sampling tool, and it’s the diagnostic method recommended almost identically across provider documentation from RamNode, BitLaunch, and AWS re:Post. Latency should climb gradually hop-by-hop as packets travel farther; a sudden large jump at one specific hop means that link is congested or degraded.
The part most people skip: run it bidirectionally. APAC routing is frequently asymmetric: the path your traffic takes to the VPS and the path the response takes back can go through completely different networks. Network engineers investigating a support ticket will typically ask for a “bi-directional, 100-count MTR” specifically so they can see both directions.
# From your local machine to the VPS
mtr -rwc 100 your-server-ip

# From the VPS back to your location (if you have working SSH access)
mtr -rwc 100 your-client-ip
A practical sequence:
- Run
ping -c 100 [target]from your client location for a baseline. - Run
mtr -rwc 100 [target]from client to VPS, and the reverse if SSH still works. - Repeat at a different time of day (once during your regional evening and once off-peak) to test for time-of-day congestion.
- Cross-check against Vultr’s own Looking Glass for Singapore (sgp-ping.vultr.com) and a Tokyo-region Looking Glass, to separate “this is Singapore specifically” from “this is my ISP’s path to Vultr generally.”
What we measured: Vultr Singapore vs Tokyo, side by side
To check the diagnosis steps above against real numbers, we ran them ourselves on September 25, 2026 (around 08:40 UTC). We created two fresh Vultr Regular Cloud Compute instances on the vc2-1c-1gb plan ($5/month, 1 vCPU, 1GB RAM), one in Singapore (sgp) and one in Tokyo (nrt), both on Ubuntu 24.04. From each one we ran a 20-cycle mtr to the same set of public Linode speedtest hosts. Then we pinged both instances 20 times from a home connection in Seoul, South Korea. Every measurement was run once, so treat this as a single short snapshot of one morning’s routing, not a long-term benchmark.
# On each Vultr instance (sgp and nrt)
for h in speedtest.tokyo2.linode.com speedtest.singapore.linode.com \
         speedtest.mumbai1.linode.com speedtest.sydney1.linode.com \
         speedtest.frankfurt.linode.com speedtest.newark.linode.com; do
  mtr -rwbz -c 20 "$h"
done

# From a Windows PC on a home connection in Seoul, to each instance
ping -n 20 <instance-ip>| Destination (Linode speedtest host) | From Vultr Singapore | From Vultr Tokyo |
|---|---|---|
| Tokyo (speedtest.tokyo2) | 68.0ms | 1.0ms |
| Singapore (speedtest.singapore) | 1.0ms | 76.6ms |
| Mumbai (speedtest.mumbai1) | 88.0ms | 122.0ms |
| Frankfurt (speedtest.frankfurt) | 166.5ms | 238.5ms |
| Newark, US East (speedtest.newark) | 244.8ms | 174.7ms |
| Sydney (speedtest.sydney1) | Hostname did not resolve | Hostname did not resolve |
Average round-trip time at the final hop over 20 mtr cycles; 0.0% loss at every final hop that responded. Our test, September 25, 2026, single run.
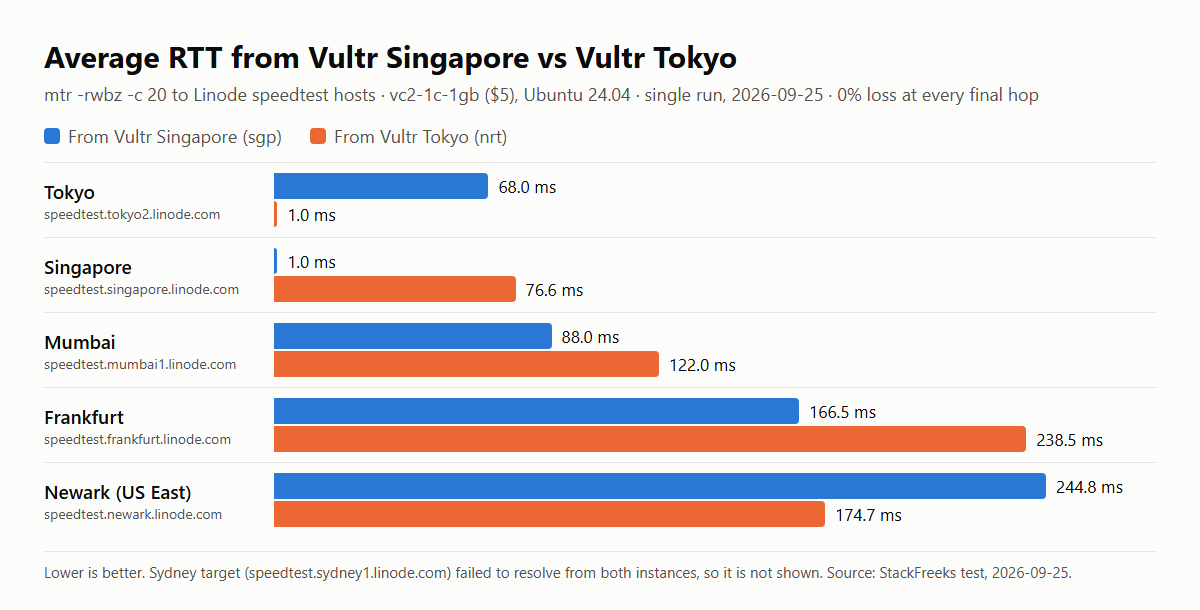
The Singapore instance itself wasn’t slow. It showed zero loss to every destination, 1.0ms to the Singapore speedtest host, 68.0ms to Tokyo and 88.0ms to Mumbai. Nothing in that run looks like the 300ms reports quoted at the top of this guide. When a Vultr Singapore server feels slow, the cause usually sits on the path between the user and the server: where the user is, how their ISP routes, and where the traffic is headed. That path is exactly what the ping-and-mtr steps above isolate.
The more useful finding came from comparing the two regions. From Tokyo, Frankfurt came back at 238.5ms versus 166.5ms from Singapore, and the router hostnames in the Tokyo trace show why: NTT carried the traffic east across the Pacific, through hops named for Seattle and Newark, and then on to London and Frankfurt, while the Singapore trace went west via Milan. It flips for the US East Coast: Tokyo reached Newark in 174.7ms, Singapore in 244.8ms. Same plan, same price, same OS, and a 70-72ms swing in either direction purely from which region sat closer to the destination. That’s the practical version of the plan-upgrade point further down: a bigger instance can’t change which way your packets travel.
Measuring from where your users actually are shifts the picture again. From our home connection in Seoul, 20 pings to the Tokyo instance averaged 38ms (37-49ms), while the Singapore instance averaged 87ms (87-88ms), both with 0% loss; two other Tokyo instances we pinged from the same connection averaged 38ms and 40ms. For a Korean audience, that’s roughly 50ms added to every round trip before your app does any work. Collect that kind of number from your own audience’s locations before picking a region, rather than borrowing ours.
Here’s the Singapore-to-Tokyo trace from that run, trimmed only by removing three non-responding hops near the end. It’s a good reference for what a healthy long-haul path looks like:
$ mtr -rwbz -c 20 speedtest.tokyo2.linode.com
HOST: vultr                                                            Loss%   Snt   Last   Avg  Best  Wrst StDev
  1. AS???    169.254.169.254                                           0.0%    20    0.3   0.3   0.2   0.4   0.0
  2. AS20473  vl199-ds1-b5-r1252.sgp1.constant.com (45.32.96.161)       0.0%    20    3.3   4.1   3.3   9.0   1.7
  3. AS???    10.79.0.193                                               0.0%    20    2.5   3.7   1.0  20.0   4.6
  4. AS???    10.79.3.49                                                0.0%    20    0.6   0.5   0.4   0.7   0.1
  5. AS2914   ae-23.a03.sngpsi07.sg.bb.gin.ntt.net (116.51.18.133)      0.0%    20    1.0   3.3   0.9  34.3   7.5
  6. AS2914   ae-3.r24.sngpsi07.sg.bb.gin.ntt.net (129.250.6.64)       55.0%    20    1.2   1.1   1.0   1.2   0.1
  7. AS2914   ae-4.a02.sngpsi07.sg.bb.gin.ntt.net (129.250.6.63)        0.0%    20    0.9   1.0   0.8   1.4   0.1
  8. AS2914   ae-2.akamai.sngpsi07.sg.bb.gin.ntt.net (140.174.28.194)   0.0%    20    0.8   0.9   0.8   1.0   0.1
  9. AS20940  ae5.r21.sin01.ien.netarch.akamai.com (104.74.134.126)     0.0%    20    0.9   1.0   0.8   1.5   0.2
 10. AS20940  ae2.r22.sin01.mag.netarch.akamai.com (104.74.134.88)      0.0%    20    1.2   1.2   1.1   1.4   0.1
 11. AS20940  ae1.r22.sin01.icn.netarch.akamai.com (104.74.134.75)      0.0%    20    0.8   0.9   0.8   1.2   0.1
 12. AS20940  ae15.r22.tyo01.icn.netarch.akamai.com (23.215.54.89)      0.0%    20   67.9  67.6  67.4  67.9   0.1
 13. AS20940  ae1.r22.tyo01.mag.netarch.akamai.com (104.74.133.70)      0.0%    20   67.7  67.8  67.6  68.3   0.2
 14. AS20940  ae32.r21.tyo01.ien.netarch.akamai.com (104.74.133.81)     0.0%    20   67.6  67.5  67.3  67.6   0.1
 15. AS20940  ae22.gw1-shg1.netarch.akamai.com (23.56.131.25)           0.0%    20   78.1  71.8  67.9  92.0   6.6
    (hops 16-18: no reply, trimmed)
 19. AS63949  speedtest.shg1.linode.com (139.162.65.37)                 0.0%    20   68.0  68.0  67.9  68.7   0.2
How to read it:
- Follow the AS column (that’s the
-zflag). The path starts in AS20473 (Vultr’s network), hands off to AS2914 (NTT) inside Singapore, then to AS20940 (Akamai, which now runs Linode’s network) and ends in AS63949 (Linode). Each change of AS number is a handoff between networks, and those handoffs are where the peering problems described below would show up. - Find the one big jump. Average latency stays within about 4ms through hop 11 (a router tagged “sin01”), then jumps to 67.6ms at hop 12 (“tyo01”). That’s the undersea crossing from Singapore to Tokyo, and it’s expected. The final hop averages 68.0ms, barely above it, so nothing after the crossing added delay.
- Ignore loss that doesn’t carry forward. Hop 6 shows 55.0% loss, yet every hop after it shows 0.0%. That’s a router rate-limiting its replies to mtr’s probes, not real packet loss. The same applies to the Tokyo instance’s second hop, which averaged 4283ms in its Frankfurt trace while the final hop held a steady 238.5ms. Only loss or latency that persists to the last hop affects your traffic.
Why Singapore specifically has this problem
Singapore is the most heavily-cabled city in Asia-Pacific, with more than 30 submarine cable systems making landfall there. Under normal conditions, that density is a strength. Singapore is used as APAC’s reference connectivity hub precisely because it has so many alternative paths that traffic can reroute if one system faults.
The failure mode is convergence. Because so many cable systems land at a small number of physical stations, those stations themselves become chokepoints. Industry reporting on APAC subsea infrastructure specifically names Singapore, Hong Kong, and Japan as critical nodes where many systems converge at the same few landing points, “creating vulnerabilities,” and documents observed transient latency spikes at the Changi South landing station, typically resolving within hours but tied to maintenance windows, sporadic congestion, and ongoing peering renegotiations. Periodic undersea fiber cuts on EU-APAC routes are also a recurring topic in VPS forum discussions, and these ripple through Singapore transit even when Singapore’s own infrastructure isn’t the actual point of failure.
Global internet traffic also peaks in the evening, roughly 6 p.m. to 11 p.m. in a given region (sometimes called “internet rush hour”), and shared-bandwidth VPS infrastructure is most likely to show congestion during that window because cross-border backbone links are closer to capacity. Community reports specific to Vultr describe a comparable pattern, with one user citing a peak window around 3 p.m. to midnight in their local time zone. If your Singapore VPS is slow only during specific hours and fine the rest of the day, that’s the signature of shared-bandwidth congestion, not a hardware fault, and it points you toward a different fix than a constant, all-day slowdown would.
Notably, this isn’t unique to Singapore. Vultr’s forum also has a documented thread about extreme packet loss on its Australia servers, and Vultr has had at least one partial network outage that listed Singapore among affected locations alongside Atlanta, Chicago, Miami, Silicon Valley, Sydney, and Tokyo. The pattern of “specific Vultr APAC region + international connectivity complaint” recurs across the footprint whenever a route or peering path is under strain.
Network latency or CPU steal? They’re not the same problem
“My server feels slow” can mean two completely different things, and they need different diagnostic tools. A clean mtr (no packet loss, no unusual hop latency) with a still-sluggish app is the signal to stop looking at the network and start checking CPU steal time instead. We cover that compute-layer diagnosis in detail in our guide to diagnosing noisy neighbors on Vultr with steal time, including the top/vmstat/mpstat commands and the threshold where steal time actually becomes a problem worth acting on.
The two can compound (a VPS can have both a bad network path and a noisy neighbor stealing CPU cycles at the same time), so don’t assume one explains everything just because you found evidence of it. Run both checks before deciding on a fix.
Fix #1: switch to Tokyo or Osaka if your audience is Northeast Asia
Vultr runs several APAC regions beyond Singapore, including Tokyo, Osaka, Seoul, Mumbai, and Sydney. Singapore is genuinely well-positioned for Southeast Asian traffic (Indonesia, Malaysia, Thailand, Vietnam), which is exactly why it’s the default recommendation for that audience. A region switch only helps if your actual visitors are weighted toward Japan or Korea instead; in that case the new region gives you a genuinely shorter, less-congested path.
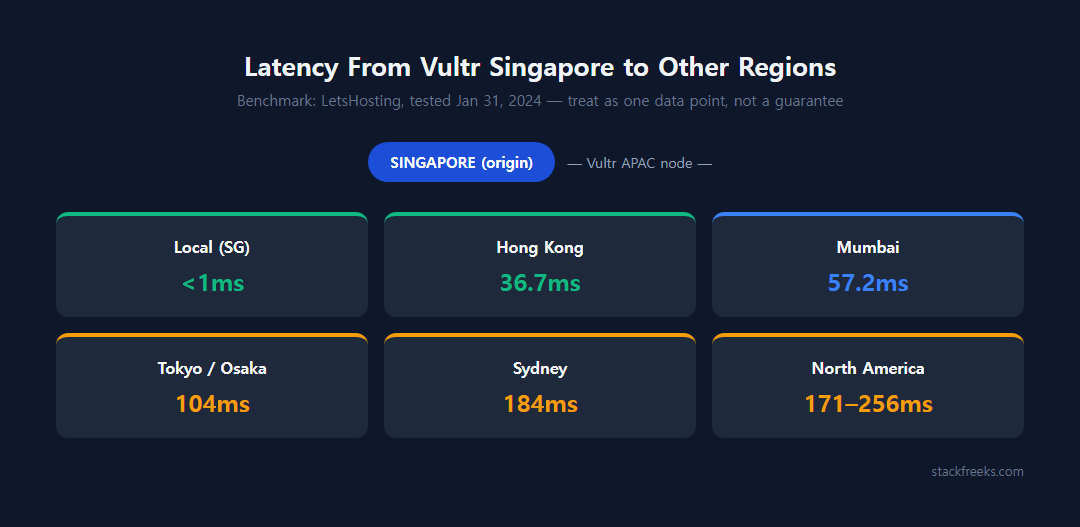
The LetsHosting benchmark referenced earlier illustrates the tradeoff in concrete numbers (treat this as one benchmark from one test date, not a controlled repeated study):
| From Vultr Singapore to… | Latency |
|---|---|
| Local Singapore endpoints | Sub-1ms |
| Hong Kong | ~36.69ms |
| Mumbai | ~57.21ms |
| Tokyo / Sydney | 104-184ms |
| North America | 171-256ms |
Benchmark data: LetsHosting, tested January 31, 2024.
Our own single run on September 25, 2026 came in faster to Tokyo (68.0ms) but slower to Mumbai (88.0ms) than these 2024 figures, while 244.8ms to Newark sits inside LetsHosting’s North America range. The test hosts and the year differ, and routes shift, so re-measure rather than trust any single table, ours included.
If most of your traffic is Japanese or Korean, a real Tokyo or Osaka instance will very likely beat Singapore for that audience rather than just moving the bottleneck. Before committing to a migration, self-test with Vultr’s own Looking Glass tool (region-specific subdomains like sgp-ping.vultr.com) or independent testers like cloudping.cloud/vultr and pingtestlive.com/vultr-ping. Run the test from your actual audience’s approximate locations, not just your own.
Spinning up a parallel instance in a different region to compare is inexpensive. Vultr currently runs Regular Cloud Compute plans from roughly $3.50-6/month, and new accounts get $300 in free credit valid for 30 days, which is more than enough to test a Tokyo or Osaka instance side by side with your existing Singapore server before you commit to migrating anything.
Fix #2: put a CDN in front of the origin
A CDN addresses a specific failure mode: every visitor’s request having to cross the congested long-haul link to reach Singapore directly. Instead, cached static assets (images, CSS, JS, and in some setups full-page HTML) get served from an edge point-of-presence physically closer to the visitor, so the Singapore path only gets hit for actual dynamic or uncached requests.
Two commonly compared options for this: Cloudflare, with a global average latency cited around 28ms, a large PoP network, DDoS protection, and routing through Hong Kong PoPs (relevant if you have mainland China traffic); and BunnyCDN, cited slightly lower at around 24ms average, generally regarded as a cost-effective performance upgrade with cached-asset TTFB often dropping under 30ms, and noted for better direct China static-asset delivery on image-heavy sites. Neither figure is a guarantee under your specific conditions. Both are provider-published or aggregated averages, not a head-to-head test.
Be clear-eyed about what a CDN actually fixes: it solves the “every visitor round-trips through the congested Singapore path” problem for static content, but it does nothing for dynamic, uncacheable requests: API calls, logged-in dashboard pages, and database writes still traverse the same network path as before. For a mostly-static or well-cached WordPress site, a CDN alone can resolve most of the perceived slowness. For a dynamic app, it helps but isn’t the whole answer.
Last verified: 2026-09-04.
Fix #3 (situational): when it’s a peering problem you can’t fix yourself
Border Gateway Protocol (BGP) determines the actual path packets take between networks. A technically valid BGP path isn’t necessarily the fastest one, and better peering (a provider having direct relationships at Internet Exchange Points with the networks your visitors’ ISPs use) reduces the number of autonomous systems traffic has to cross. Industry guidance notes this can shave “multiple tens of milliseconds” off a path compared to routing through extra upstream providers. APAC routing is specifically flagged as harder to get right than other regions, partly because local ISPs deal with overloaded links or paths that don’t follow the geographically obvious route.
This one isn’t actionable the way the first two fixes are: you can’t change your VPS provider’s peering arrangements yourself. But your mtr output tells you when this is what you’re dealing with: if the added latency is concentrated at a specific transit-provider hop in the middle of the path, rather than at the first hop (your ISP) or the last hop (Vultr’s own network), that’s evidence of a peering or transit problem outside your direct control. At that point your options are to switch region, add a CDN so fewer requests need to cross that hop, or, if the pattern is consistent and severe, open a support ticket with the specific mtr output attached as evidence. Providers can sometimes work with an upstream transit provider to resolve a known bad path, but it’s not something you fix from your own terminal.
Does upgrading your Vultr plan fix this? No, and here’s why
It’s tempting to reach for a bigger plan when something feels slow, but no source here supports that logic for a network-routing problem. Plan tier is a compute and storage lever. It changes CPU allocation, memory, and disk I/O, not your BGP path or which submarine cable your traffic crosses. Moving from a Regular Cloud Compute instance to High Frequency or a dedicated-vCPU Optimized Cloud Compute plan can absolutely help if your slowness is compute-adjacent (noisy-neighbor CPU steal, disk contention), but it does not change your routing to or from Singapore. If your mtr results show the latency, upgrading the instance tier is the wrong lever; region choice and CDN placement are the levers that actually touch the network path.
Diagnose before you migrate
Don’t skip straight to a region switch or a plan upgrade the moment you notice Vultr Singapore Slow performance. Run the ping-then-mtr sequence first, bidirectionally, at more than one time of day. If your results are clean and the slowness persists, check CPU steal time next; the two problems look identical from the outside but need entirely different fixes. When we ran that sequence ourselves from fresh $5 instances, Singapore came back clean; what moved the numbers by 70ms or more was the region’s position relative to the destination, not anything wrong with the server.
If the mtr output does point to routing (a jump at a specific hop, worse latency during your regional evening peak), match the fix to your actual audience: a CDN if most of the traffic is static content getting hit repeatedly across that congested link, a region switch to Tokyo or Osaka only if your visitors are genuinely Northeast-Asia-weighted, and a support ticket with your mtr evidence if it’s a peering issue you can’t touch yourself. What won’t fix a routing problem is a bigger plan. Save that upgrade for when your diagnostics point to compute, not network. Vultr’s $300 in free credit makes it cheap to spin up a comparison instance in another region before you decide anything permanent.